AccountingQueen

(3)

$16/per page/Negotiable

About AccountingQueen

Levels Tought:
Elementary,Middle School,High School,College,University,PHD

Expertise:
Accounting,Algebra See all
Accounting,Algebra,Applied Sciences,Architecture and Design,Art & Design,Biology,Business & Finance,Calculus,Chemistry,Communications,Computer Science,Economics,Engineering,English,Environmental science,Essay writing,Film,Foreign Languages,Geography,Geology,Geometry,Health & Medical,History,HR Management,Information Systems,Law,Literature,Management,Marketing,Math,Numerical analysis,Philosophy,Physics,Precalculus,Political Science,Psychology,Programming,Science,Social Science,Statistics Hide all
Teaching Since: Jul 2017
Last Sign in: 362 Weeks Ago, 1 Day Ago
Questions Answered: 5502
Tutorials Posted: 5501

Education

  • MBA.Graduate Psychology,PHD in HRM
    Strayer,Phoniex,
    Feb-1999 - Mar-2006

  • MBA.Graduate Psychology,PHD in HRM
    Strayer,Phoniex,University of California
    Feb-1999 - Mar-2006

Experience

  • PR Manager
    LSGH LLC
    Apr-2003 - Apr-2007

Category > Math Posted 14 Aug 2017 My Price 10.00

The frequency distribution

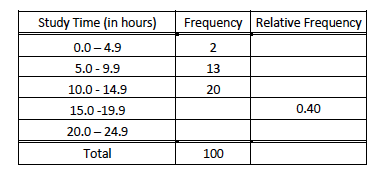
3. A random sample of 100 students was chosen from UMUC STAT 200 classes. The frequency distribution below shows the distribution for study time each week (in hours). (Show all work. Just the answer, without supporting work, will receive no credit.)

Study Time (in hours) 

Screen Shot 2017-07-27 at 9.08.13 PM.png

(a) Complete the frequency table with frequency and relative frequency. Express the relative frequency to two decimal places. 

(b) What percentage of the study times was at least 10 hours? 

(c) In what class interval must the median lie? 5.0 - 9.9, 10.0 -14.9, 15.0 - 19.9, or 20.0 - 24.9? 

Why? 


4. The five-number summary below shows the grade distribution of a STAT 200 quiz for a sample of 150 students. 

Answer each question based on the given information, and explain your answer in each case. 


Screen Shot 2017-07-27 at 9.09.14 PM.png


(a) What is the range in the grade distribution? 

(b) Which of the following score bands has the fewest students? 

(i) 35 - 50 

(ii) 50 - 65 

(iii) 85 - 100 

(Iv) Cannot be determined 

(c) How many students in the sample are in the score band between 65 and 100? 


5. A basket contains 3 white balls, 2 yellow balls, and 5 red balls. Consider selecting one ball at a time from the basket. (Show all work. Just the answer, without supporting work, will receive no credit.) 

(a) Assuming the ball selection is with replacement. What is the probability that the first ball is red and the second ball is also red? 

(b) Assuming the ball selection is without replacement. What is the probability that the first ball is red and the second ball is also red? 

Attachments:

Answers

(3)
Status NEW Posted 14 Aug 2017 02:08 PM My Price 10.00

Hel-----------lo -----------Sir-----------/Ma-----------dam----------- T-----------han-----------k y-----------ou -----------for----------- us-----------ing----------- ou-----------r w-----------ebs-----------ite----------- an-----------d a-----------cqu-----------isi-----------tio-----------n o-----------f m-----------y p-----------ost-----------ed -----------sol-----------uti-----------on.----------- Pl-----------eas-----------e p-----------ing----------- me----------- on----------- ch-----------at -----------I a-----------m o-----------nli-----------ne -----------or -----------inb-----------ox -----------me -----------a m-----------ess-----------age----------- I -----------wil-----------l

Not Rated(0)