The world’s Largest Sharp Brain Virtual Experts Marketplace Just a click Away
Levels Tought:
Elementary,High School,College,University,PHD
| Teaching Since: | May 2017 |
| Last Sign in: | 352 Weeks Ago, 5 Days Ago |
| Questions Answered: | 20103 |
| Tutorials Posted: | 20155 |
MBA, PHD
Phoniex
Jul-2007 - Jun-2012
Corportae Manager
ChevronTexaco Corporation
Feb-2009 - Nov-2016
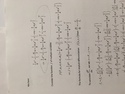
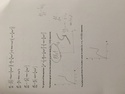
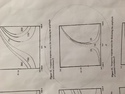
sketching the graph of the equation(which circle it in first image ) for( f) with all parameters ( a ,alpha one ,alpha two, mu one, sigma) by using wolfram Alpha program . (f)should be always in the x axis(you should write F in the graphs) , and all parameters in y axis (you should write them in graphs) . I want just positive side from axis in the all graphs expect sigma I want two sides. I want the picture of graph big enough not small. there are some examples of the graphs I included in files . it will be very similar. make sure you take small values for alpha to get perfect graph.
Attachments:
Hel-----------lo -----------Sir-----------/Ma-----------dam----------- T-----------han-----------k Y-----------ou -----------for----------- us-----------ing----------- ou-----------r w-----------ebs-----------ite----------- an-----------d a-----------cqu-----------isi-----------tio-----------n o-----------f m-----------y p-----------ost-----------ed -----------sol-----------uti-----------on.----------- Pl-----------eas-----------e p-----------ing----------- me----------- on----------- ch-----------at -----------I a-----------m o-----------nli-----------ne -----------or -----------inb-----------ox -----------me -----------a m-----------ess-----------age----------- I -----------wil-----------l