
Martinakom
$12/per page/Negotiable
Hi, can you answer these in the next 30 minutes?
 
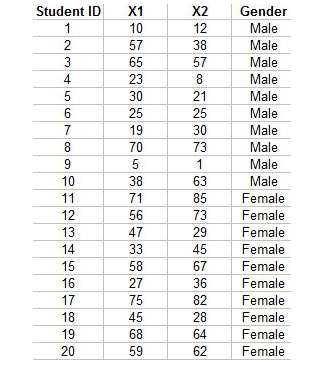
For the first 15 questions on this Excel-based assessment use the data provided in the following table where X1 and X2 are before and after scores on a standardized test for 20 students. Use 5% level of significance for all tests unless instructed otherwise.
 
 
A. 18
 B. 40
 C. 19
 D. 20
 
 
Question 2 of 30
Perform a one sample t test in order to evaluate whether or not the average X1 value equals 70 in the population. The hypoyhesized value of population mean in this test is: A. 70
 B. 2.09
 C. 5.37
 D. Less than 0.001
 
 
Question 3 of 30
Perform a one sample t test in order to evaluate whether or not the average X1 value equals 70 in the population. The obserevd t value for this test is: 
A. 2.09
 B. 70
 C. 5.37
 D. Less than 0.001
 
 
Question 4 of 30
Perform a one sample t test in order to evaluate whether or not the average X1 value equals 70 in the population. The critical t value for this test is: 
A. 70
 B. 2.09
 C. Less than 0.001
 D. 5.37
 
 
Question 5 of 30
Perform a one sample t test in order to evaluate whether or not the average X1 value equals 70 in the population. The p value for this test is: 
A. 5.37
 B. 2.09
 C. Less than 0.001
 D. 70
 
 
Question 6 of 30
Perform a one sample t test in order to evaluate whether or not the average X1 value equals 70 in the population. The conclusion for this test is: 
A. Reject both the null and alternative hypotheses
 B. ccept both the null and alternative hypotheses
 C. Reject the null hypothesis
 D. Fail to reject the null hypothesis
 
Question 7 of 30
Perform a paired samples t test in order to evaluate whether or not the mean value of X1 equals the mean value of X2 in the population. The degrees of freedom for this test equal: A. 20
 B. 40
 C. 19
 D. 18
 
 
Question 8 of 30
Perform a paired samples t test in order to evaluate whether or not the mean value of X1 equals the mean value of X2 in the population. The obserevd t value for this test is: A. 0.32
 B. Less than 0.001
 C. 0.05
 D. 2.09
 
 
Question 9 of 30
Perform a paired samples t test in order to evaluate whether or not the mean value of X1 equals the mean value of X2 in the population. The critical t value for this test is: A. Less than 0.001
 B. 0.32
 C. 0.05
 D. 2.09
 
 
Question 10 of 30
Perform a paired samples t test in order to evaluate whether or not the mean value of X1 equals the mean value of X2 in the population. The p value for this test is: A. 0.751
 B. 2.09
 C. 0.05
 D. 5.37
 
 
Question 11 of 30
Perform a paired samples t test in order to evaluate whether or not the mean value of X1 equals the mean value of X2 in the population. The conclusion for this test is: A. ccept both the null and alternative hypotheses
 B. Reject the null hypothesis
 C. Reject both the null and alternative hypotheses
 D. Fail to reject the null hypothesis
 
 
Question 12 of 30
Perform an independent samples t test in order to evaluate whether the average X1 score of male students equals the average X1 score of female students in the population. The degrees of freedom for this test equal: A. 19
 B. 38
 C. 18
 D. 20
 
 
Question 13 of 30
Perform an independent samples t test in order to evaluate whether the average X1 score of male students equals the average X1 score of female students in the population. The observed t value for this test is: A. 0.05
 B. 2.24
 C. 2.10
 D. 0.038
 
 
Question 14 of 30
Perform an independent samples t test in order to evaluate whether the average X1 score of male students equals the average X1 score of female students in the population. The p value for this test is: A. 0.038
 B. 0.05
 C. 2.10
 D. 2.24
 
 
Question 15 of 30
Perform an independent samples t test in order to evaluate whether the average X1 score of male students equals the average X1 score of female students in the population. The conclusion for this test is: A. Reject both the null and alternative hypotheses
 B. Reject the null hypothesis
 C. Fail to reject the null hypothesis
 D. ccept both the null and alternative hypotheses
Attachments: