
Martinakom
$12/per page/Negotiable
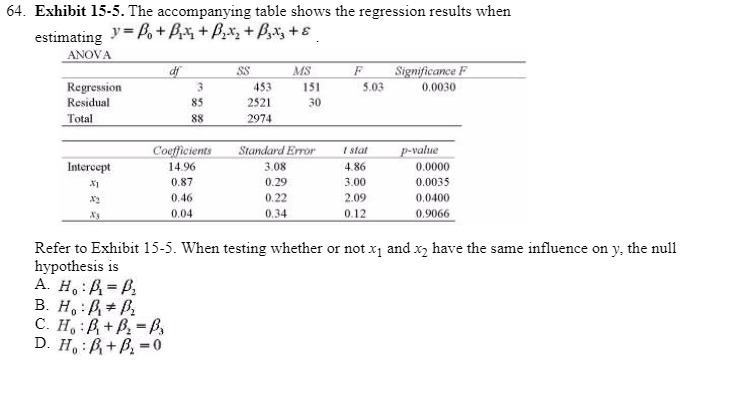
64. Exhibit 15-5. The accompanying table shows the regression results when estimating y = ’¼é, + ’¼éi-ŌĆśi + ’¼élxz + Ax, + s . :\i\'( )\';\ LII .\.\' AVIS [5 Significance I Regression 3 453 ISI 5 ()3 0.0030 RcSIdual 85 352] 30 Total xx 297-8 L 'uqfliclcnls Slum/41rd ’¼ürm┬╗ I slul p-m/m: lnlcrccm H 96 3 08 4 86 0 1mm) .\'1 0.87 0.29 3 ()0 0.0035 .\': 0.46 0 23 209 0.0400 .n 0.04 0.34 0 L? 09066 Refer to Exhibit 15-5. When testing whether or not x1 and x2 have the same in’¼éuence on y, the null hypothesis is A' Ho:pi=pz B' HM’¼é’¼üt/Iz C- [{u:l’¼ül+’¼él=’¼é! D- Huz’¼él+’¼él=0┬Ā
This text was automatically generated from the attachment. Please refer to the attachment to view this question.┬Ā
This question was created from Analytical Methods for Business, Completed Text Exam, Chapter 15┬Āhttps://www.coursehero.com/file/11361701/Analytical-Methods-for-Business-Completed-Text-Exam-Chapter-15/?focusQaId=10819995