The world’s Largest Sharp Brain Virtual Experts Marketplace Just a click Away
Levels Tought:
Elementary,Middle School,High School,College,University,PHD
| Teaching Since: | Jul 2017 |
| Last Sign in: | 362 Weeks Ago, 2 Days Ago |
| Questions Answered: | 5502 |
| Tutorials Posted: | 5501 |
MBA.Graduate Psychology,PHD in HRM
Strayer,Phoniex,
Feb-1999 - Mar-2006
MBA.Graduate Psychology,PHD in HRM
Strayer,Phoniex,University of California
Feb-1999 - Mar-2006
PR Manager
LSGH LLC
Apr-2003 - Apr-2007
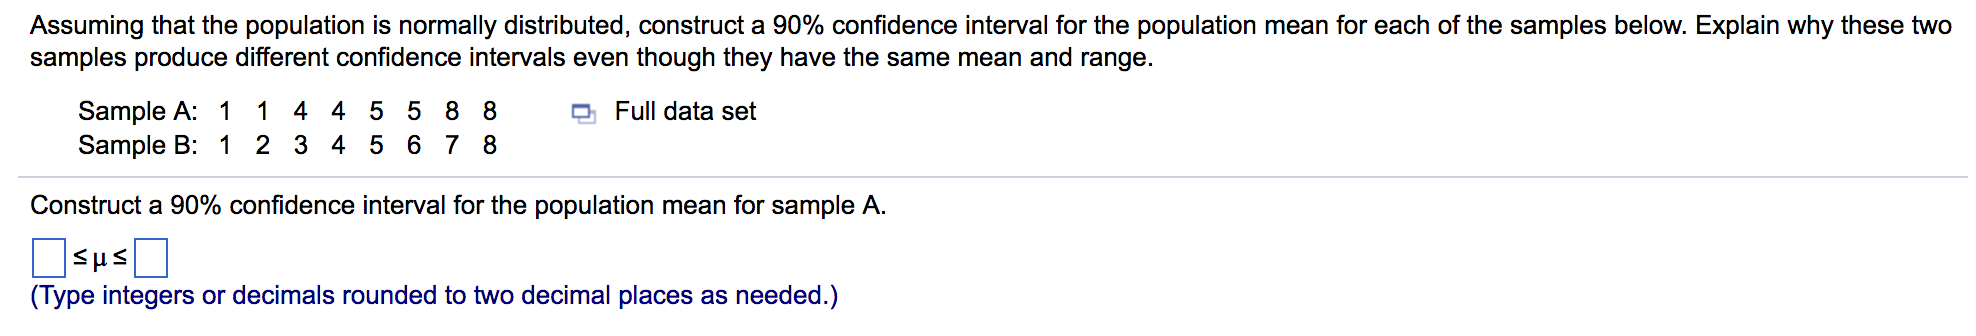
Assuming that the population is normally​ distributed, construct a 90​% confidence interval for the population mean for each of the samples below. Explain why these two samples produce different confidence intervals even though they have the same mean and range.
Â
There are 2 more parts to this question that I will post once part a is answered under the comment box.
Â
 H-----------ell-----------o S-----------ir/-----------Mad-----------am ----------- -----------Tha-----------nk -----------you----------- fo-----------r u-----------sin-----------g o-----------ur -----------web-----------sit-----------e a-----------nd -----------acq-----------uis-----------iti-----------on -----------of -----------my -----------pos-----------ted----------- so-----------lut-----------ion-----------. P-----------lea-----------se -----------pin-----------g m-----------e o-----------n c-----------hat----------- I -----------am -----------onl-----------ine----------- or----------- in-----------box----------- me----------- a -----------mes-----------sag-----------e I----------- wi-----------ll