The world’s Largest Sharp Brain Virtual Experts Marketplace Just a click Away
Levels Tought:
Elementary,High School,College,University,PHD
| Teaching Since: | May 2017 |
| Last Sign in: | 356 Weeks Ago, 3 Days Ago |
| Questions Answered: | 20103 |
| Tutorials Posted: | 20155 |
MBA, PHD
Phoniex
Jul-2007 - Jun-2012
Corportae Manager
ChevronTexaco Corporation
Feb-2009 - Nov-2016
Â
Â
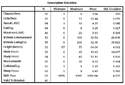
Choose one of the interval variables from the student survey. Check out the printout of means & sd's, to get the mean and sd for the variable you want to use.:Â use File below
-Identify the variable and what your response (X) is (or would be) for that variable - for example, if you use caffeine - how many caffeine drinks do you have a day? That would be your response and your score (X)
Then, find your place in that distribution. To do that, calculate your Z-score and identify the percents above and below you.
Post this information, including how you got your z-score and used the Table and Normal Curve.
Table A with Z Score attached.
Hel-----------lo -----------Sir-----------/Ma-----------dam----------- T-----------han-----------k Y-----------ou -----------for----------- us-----------ing----------- ou-----------r w-----------ebs-----------ite----------- an-----------d a-----------cqu-----------isi-----------tio-----------n o-----------f m-----------y p-----------ost-----------ed -----------sol-----------uti-----------on.----------- Pl-----------eas-----------e p-----------ing----------- me----------- on----------- ch-----------at -----------I a-----------m o-----------nli-----------ne -----------or -----------inb-----------ox -----------me -----------a m-----------ess-----------age----------- I -----------wil-----------l