The world’s Largest Sharp Brain Virtual Experts Marketplace Just a click Away
Levels Tought:
Elementary,Middle School,High School,College,University,PHD
| Teaching Since: | Jul 2017 |
| Last Sign in: | 364 Weeks Ago, 2 Days Ago |
| Questions Answered: | 1850 |
| Tutorials Posted: | 1850 |
Graduate in Biology and Nutrition, MBA Finance
Florida State University
Aug-2000 - Jul-2007
Ass. Relationship Manager
Penn-Florida
Mar-2009 - Feb-2016
que-
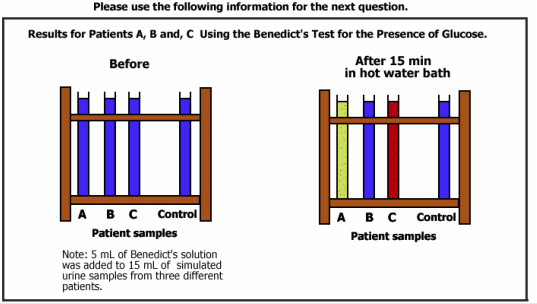
Analyze the collected data by describing the colour change, and interpret the results obtained by explaining what the colours represent.Â
Use the Benedict's Test Colour Equivalence Table on page 461 of the textbook.Â
3 marks
Â
Question: (use the above image)
Explain the results obtained by identifying the urine sample of a normal, an insulin dependent, and an insulin independent patient. Explain the cause of of their conditions.Â
3 marks
Â
que-
explain  difference between diabetes mellitus and diabetes insipidus.Â
Â
que-
dentify the variables listed below.Â
Â
 Number: ____ ____ ____ Â
Attachments:Hel-----------lo -----------Sir-----------/Ma-----------dam----------- Â----------- -----------Tha-----------nk -----------you----------- fo-----------r u-----------sin-----------g o-----------ur -----------web-----------sit-----------e a-----------nd -----------acq-----------uis-----------iti-----------on -----------of -----------my -----------pos-----------ted----------- so-----------lut-----------ion-----------.Pl-----------eas-----------e p-----------ing----------- me----------- on----------- ch-----------at -----------I a-----------m ----------- on-----------lin-----------e o-----------r i-----------nbo-----------x m-----------e a----------- me-----------ssa-----------ge -----------I