The world’s Largest Sharp Brain Virtual Experts Marketplace Just a click Away
Levels Tought:
Elementary,Middle School,High School,College,University,PHD
| Teaching Since: | May 2017 |
| Last Sign in: | 283 Weeks Ago, 1 Day Ago |
| Questions Answered: | 27237 |
| Tutorials Posted: | 27372 |
MCS,MBA(IT), Pursuing PHD
Devry University
Sep-2004 - Aug-2010
Assistant Financial Analyst
NatSteel Holdings Pte Ltd
Aug-2007 - Jul-2017
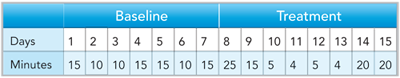
This data summary table shows a child's duration of crying in minutes during baseline and treatment phases. Develop a graph from the data summary table to show the effects of the intervention on this child's duration of crying.
Be sure all six components of a graph (see pages 45–57 in the Miltenberger text) are included. Include a brief visual analysis within and between conditions (see pages 150–155 in your Cooper, Heron, and Heward text); limitations, if any, of this design in proving that the behavior modification procedures caused the behavior change; and recommendations to improve the design, if necessary.
Â
Attachments:
----------- Â ----------- H-----------ell-----------o S-----------ir/-----------Mad-----------am ----------- Th-----------ank----------- yo-----------u f-----------or -----------usi-----------ng -----------our----------- we-----------bsi-----------te -----------and----------- ac-----------qui-----------sit-----------ion----------- of----------- my----------- po-----------ste-----------d s-----------olu-----------tio-----------ns.----------- Pl-----------eas-----------e p-----------ing----------- me----------- on----------- ch-----------at -----------I a-----------m o-----------nli-----------ne -----------or -----------inb-----------ox -----------me -----------a m-----------ess-----------age-----------