
ComputerScienceExpert
$18/per page/
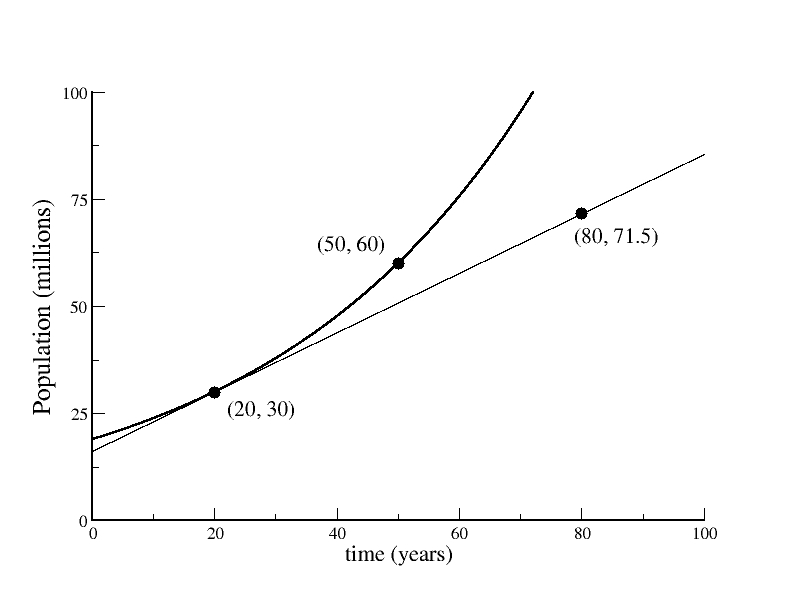
The figure below shows the size of some country's population (The figure below shows the size of some country's population (measured in millions) over the period 1900 to 2000.
The heavy curve denotes the size of the population and the thin line is a line that is tangent to the curve at the point representing 1920.
Â
The labeled points on the curve show the country's population in 1920 (30 millions) and in 1950 (60 millions).
The tangent line passes through the point (80, 71.5).
What was the average growth rate of the population (in millions of people per year) over the period 1920 to 1950?Â
Give your answer correct to three decimal places.
Average growth rate :Â
What was the growth rate of the population in 1920?Â
(Again, give your answer in millions of people per year, correct to three decimal places.)
Growth rate in 1920 :Â
If the population had continued growing at its 1920 growth rate for the rest of the century, what would the population have been at the start of the year 2000?Â
(Give your answer in millions of people, correct to one decimal place.)
Population at year 2000 : ) over the period 1900 to 2000.
The heavy curve denotes the size of the population and the thin line is a line that is tangent to the curve at the point representing 1920.
Â
The labeled points on the curve show the country's population in 1920 (30 millions) and in 1950 (60 millions).
The tangent line passes through the point (80, 71.5).
What was the average growth rate of the population (in millions of people per year) over the period 1920 to 1950?Â
Give your answer correct to three decimal places.
Average growth rate :Â
What was the growth rate of the population in 1920?Â
(Again, give your answer in millions of people per year, correct to three decimal places.)
Growth rate in 1920 :Â
If the population had continued growing at its 1920 growth rate for the rest of the century, what would the population have been at the start of the year 2000?Â
(Give your answer in millions of people, correct to one decimal place.)
Population at year 2000 :Â
Attachments: