SuperTutor

(15)

$15/per page/Negotiable

About SuperTutor

Levels Tought:
Elementary,Middle School,High School,College,University,PHD

Expertise:
Accounting,Business & Finance See all
Accounting,Business & Finance,Economics,Engineering,HR Management,Math Hide all
Teaching Since: Apr 2017
Last Sign in: 331 Weeks Ago, 4 Days Ago
Questions Answered: 12843
Tutorials Posted: 12834

Education

  • MBA, Ph.D in Management
    Harvard university
    Feb-1997 - Aug-2003

Experience

  • Professor
    Strayer University
    Jan-2007 - Present

Category > Accounting Posted 01 Jun 2017 My Price 20.00

Part A: Horizontal Analysis

SEE ATTACHED SPREADSHEET TO RECORD ANSWERS
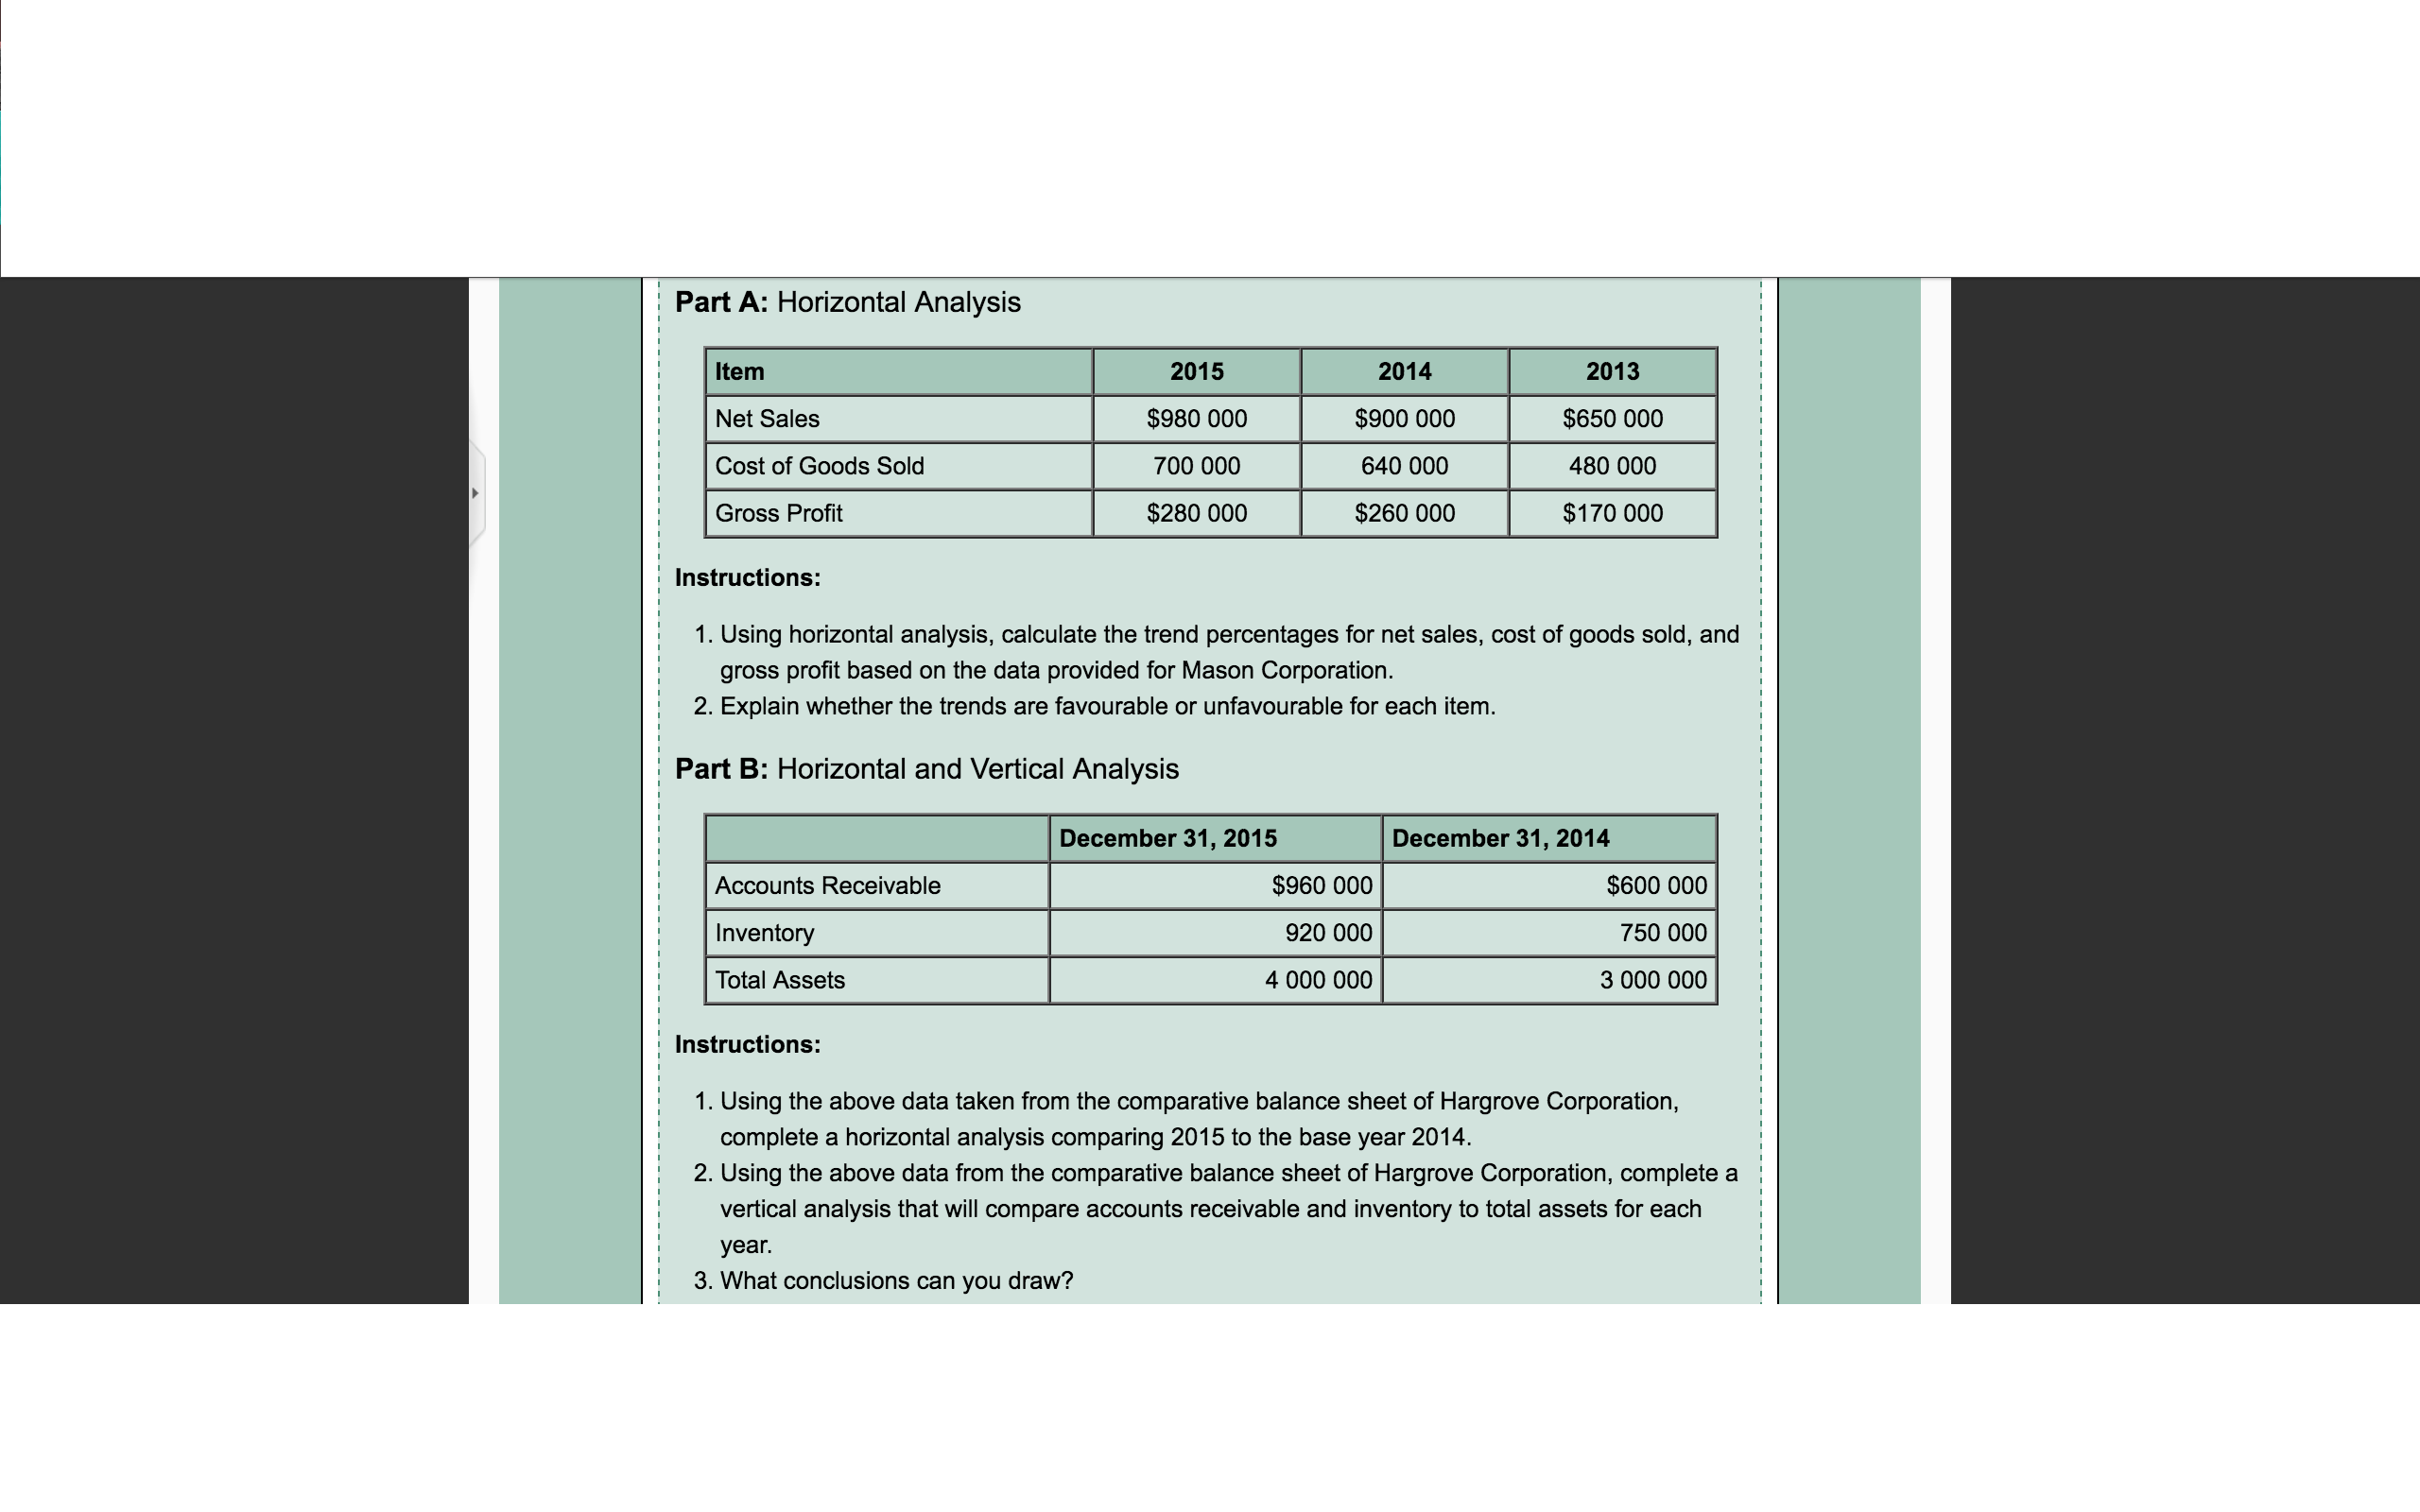
Part A: Horizontal Analysis

Item

2015

2014

2013

Net Sales

$980 000

$900 000

$650 000

Cost of Goods Sold

700 000

640 000

480 000

Gross Profit

$280 000

$260 000

$170 000

Instructions:

  1. Using horizontal analysis, calculate the trend percentages for net sales, cost of goods sold, and gross profit based on the data provided for Mason Corporation.
  2. Explain whether the trends are favourable or unfavourable for each item.

Part B: Horizontal and Vertical Analysis


December 31, 2015

December 31, 2014

Accounts Receivable

$960 000

$600 000

Inventory

920 000

750 000

Total Assets

4 000 000

3 000 000

Instructions:

  1. Using the above data taken from the comparative balance sheet of Hargrove Corporation, complete a horizontal analysis comparing 2015 to the base year 2014.
  2. Using the above data from the comparative balance sheet of Hargrove Corporation, complete a vertical analysis that will compare accounts receivable and inventory to total assets for each year.
  3. What conclusions can you draw?

Part C: Comparative Balance Sheet - Horizontal and Vertical Analysis

Assets

2014

2013

Current assets

$322

$280

Capital assets

678

520

Current liabilities

$180

$120

Long-term debt

200

160

Common shares

320

320

Retained earnings

300

200

Instructions:

  1. Using horizontal analysis, show the percentage change for each balance sheet item of Martin Corporation, using 2013 as a base year.
  2. Using vertical analysis, prepare a common size comparative balance sheet for Martin Corporation for each year.

Screen Shot 2017-05-22 at 6.58.54 PM.pngScreen Shot 2017-05-22 at 6.58.48 PM.png

Attachments:

Answers

(15)
Status NEW Posted 01 Jun 2017 05:06 AM My Price 20.00

-----------

Attachments

file 1496293734-Solutions file.docx preview (51 words )
S-----------olu-----------tio-----------ns -----------fil-----------e -----------Hel-----------lo -----------Sir-----------/Ma-----------dam----------- T-----------han-----------k y-----------ou -----------for----------- yo-----------ur -----------int-----------ere-----------st -----------and----------- bu-----------yin-----------g m-----------y p-----------ost-----------ed -----------sol-----------uti-----------on.----------- Pl-----------eas-----------e p-----------ing----------- me----------- on----------- ch-----------at -----------I a-----------m o-----------nli-----------ne -----------or -----------inb-----------ox -----------me -----------a m-----------ess-----------age----------- I -----------wil-----------l b-----------e q-----------uic-----------kly----------- on-----------lin-----------e a-----------nd -----------giv-----------e y-----------ou -----------exa-----------ct -----------fil-----------e a-----------nd -----------the----------- sa-----------me -----------fil-----------e i-----------s a-----------lso----------- se-----------nt -----------to -----------you-----------r e-----------mai-----------l t-----------hat----------- is----------- re-----------gis-----------ter-----------ed -----------onÂ----------- th-----------is -----------web-----------sit-----------e -----------Tha-----------nk -----------you----------- -----------
Not Rated(0)