
SuperTutor
$15/per page/Negotiable
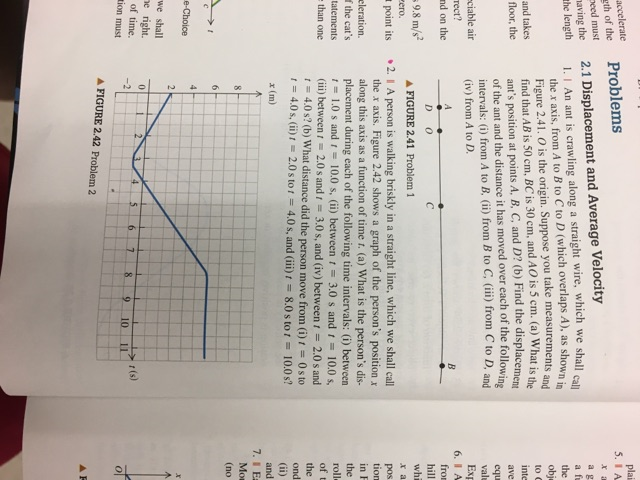
a person is walking briskly in a straight line, which we shall call the x axis. Figure 2.42 shows a graph of the person's position x along this axis as a function of time t. (a) what is the person's displacement during each of the following time intervals:(I) between t=1.0s and t=10.0s, (II) between t=3.0s and t=10.0s, (III) between t=2.0s and t= 3.0s, and between t= 2.0s and t=4.0s? (B) what distance did the person move from (I) t=0s to t=4.0s, (II) t=2.0s to t= 4.0s, and (III) t= 8.0s to t=10.0s?
Attachments: