
SuperTutor
$15/per page/Negotiable
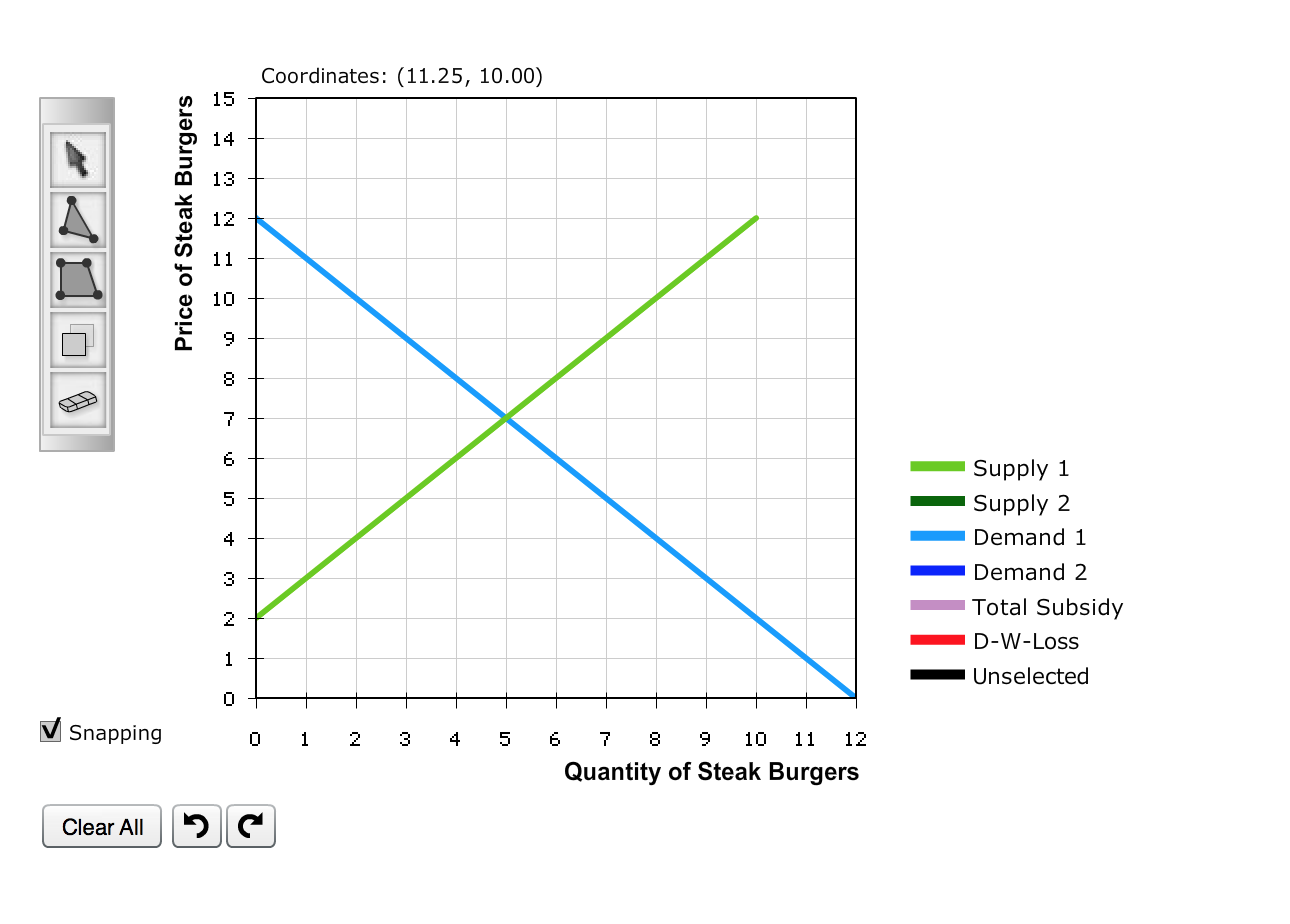
The following diagram illustrates the market for steak burgers. Suppose a subsidy of $4 per steak burger is offered to the sellers of steak burgers.
Â
Part 1: Use the copy tool to show the effect of this subsidy on either the supply or demand for steak burgers, whichever is appropriate. Label the new curve either Demand 2 or Supply 2. Â
Â
Part 2: Use an area tool to illustrate the area representing the total cost associated with the subsidy. Label this area Total Subsidy. Â
Â
Part 3: Use an area tool to illustrate the area representing the deadweight loss associated with the subsidy. Label this area D-W-Loss.
Attachments: