
SuperTutor
$15/per page/Negotiable
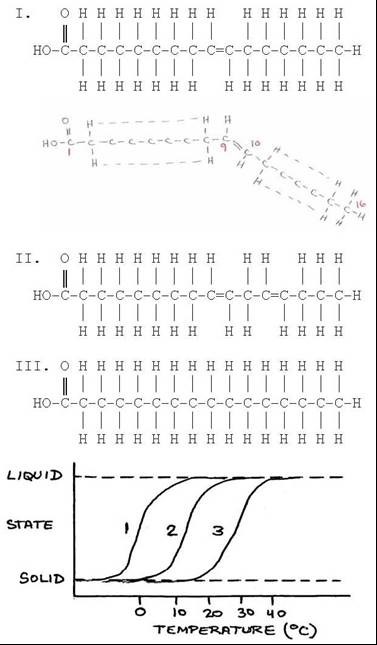
At the bottom of the accompanying figure is a graph that shows the data obtained in an experiment where fatty acids I, II, and III from three different organisms were heated, and their change from the solid state to the liquid state was observed and recorded on the y-axis versus temperature on the x-axis. The three curves (labeled 1, 2, & 3) show that each fatty acid preparation melted at a different temperature. Fatty acid I had all three fatty acids of the type labeled I in upper part of the figure. Fatty acid II had three fatty acids of the type labeled II, and Fatty acid III had three fatty acids of the type labeled III. Match each melting curve with the fatty acid that produced it.
Â