The incidence per 1000 people
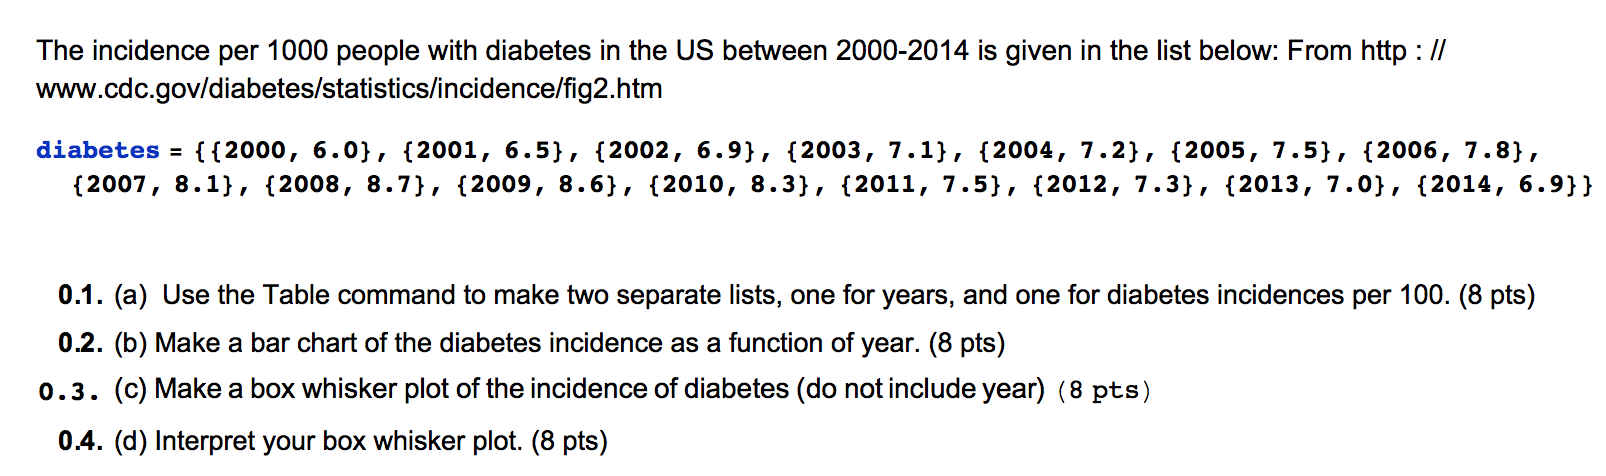
The incidence per 1000 people with diabetes in the US between 2000-2014 is given in the list below: From http :ll
www.cdc.govldiabeteslstatisticslincidencel’¼üg2.htm diabetes: {{2000, 6.0}, {2001, 6.5}, {2002, 6.9}, {2003, 7.1}, {2004, 7.2}, {2005, 7.5}, {2006, 7.8},
{2007, 8.1}, {2008, 8.7}, {2009, 8.6}, {2010, 8.3}, {2011, 7.5}, {2012, 7.3}, {2013, 7.0}, {2014, 6.9}} 0.1. (a) Use the Table command to make two separate lists, one for years, and one for diabetes incidences per 100. (8 pts)
0.2. (b) Make a bar chart of the diabetes incidence as a function of year. (8 pts)
0 . 3 . (0) Make a box whisker plot of the incidence of diabetes (do not include year) ( 8 pts) 0.4. (d) Interpret your box whisker plot. (8 pts)
Attachments:
Answers

Status NEW
Posted 03 Jul 2017 02:07 AM
My Price 5.00
-----------
Attachments
file 1499050067-Solutions file.docx preview (51 words )
S-----------olu-----------tio-----------ns -----------fil-----------e
-----------Hel-----------lo -----------Sir-----------/Ma-----------dam-----------
T-----------han-----------k y-----------ou -----------for----------- yo-----------ur -----------int-----------ere-----------st -----------and----------- bu-----------yin-----------g m-----------y p-----------ost-----------ed -----------sol-----------uti-----------on.----------- Pl-----------eas-----------e p-----------ing----------- me----------- on----------- ch-----------at -----------I a-----------m o-----------nli-----------ne -----------or -----------inb-----------ox -----------me -----------a m-----------ess-----------age----------- I -----------wil-----------l b-----------e q-----------uic-----------kly----------- on-----------lin-----------e a-----------nd -----------giv-----------e y-----------ou -----------exa-----------ct -----------fil-----------e a-----------nd -----------the----------- sa-----------me -----------fil-----------e i-----------s a-----------lso----------- se-----------nt -----------to -----------you-----------r e-----------mai-----------l t-----------hat----------- is----------- re-----------gis-----------ter-----------ed -----------on┬-----------Āth-----------is -----------web-----------sit-----------e
-----------Tha-----------nk -----------you-----------
-----------
Not Rated(0)