
SuperTutor
$15/per page/Negotiable
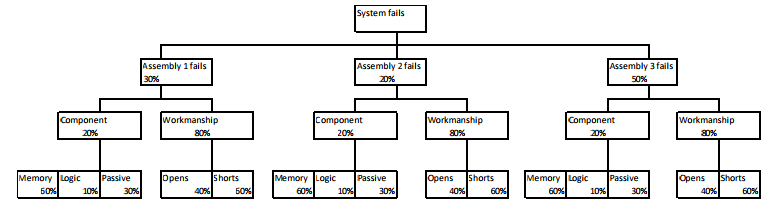
The following diagram is a fault tree analysis (FTA) of a system that consists of 3 assemblies. If the system fails, history has shown that each assembly has a certain probability of being the cause of the failure. Further, history has shown that, within each assembly, the failure could be component or workmanship. Component failures could be caused by memory, logic or passive components. Workmanship failures could be caused by opens (open circuit) or shorts (short circuits). The probability of each type of failure for each level is shown in the diagram.Â