
SuperTutor
$15/per page/Negotiable
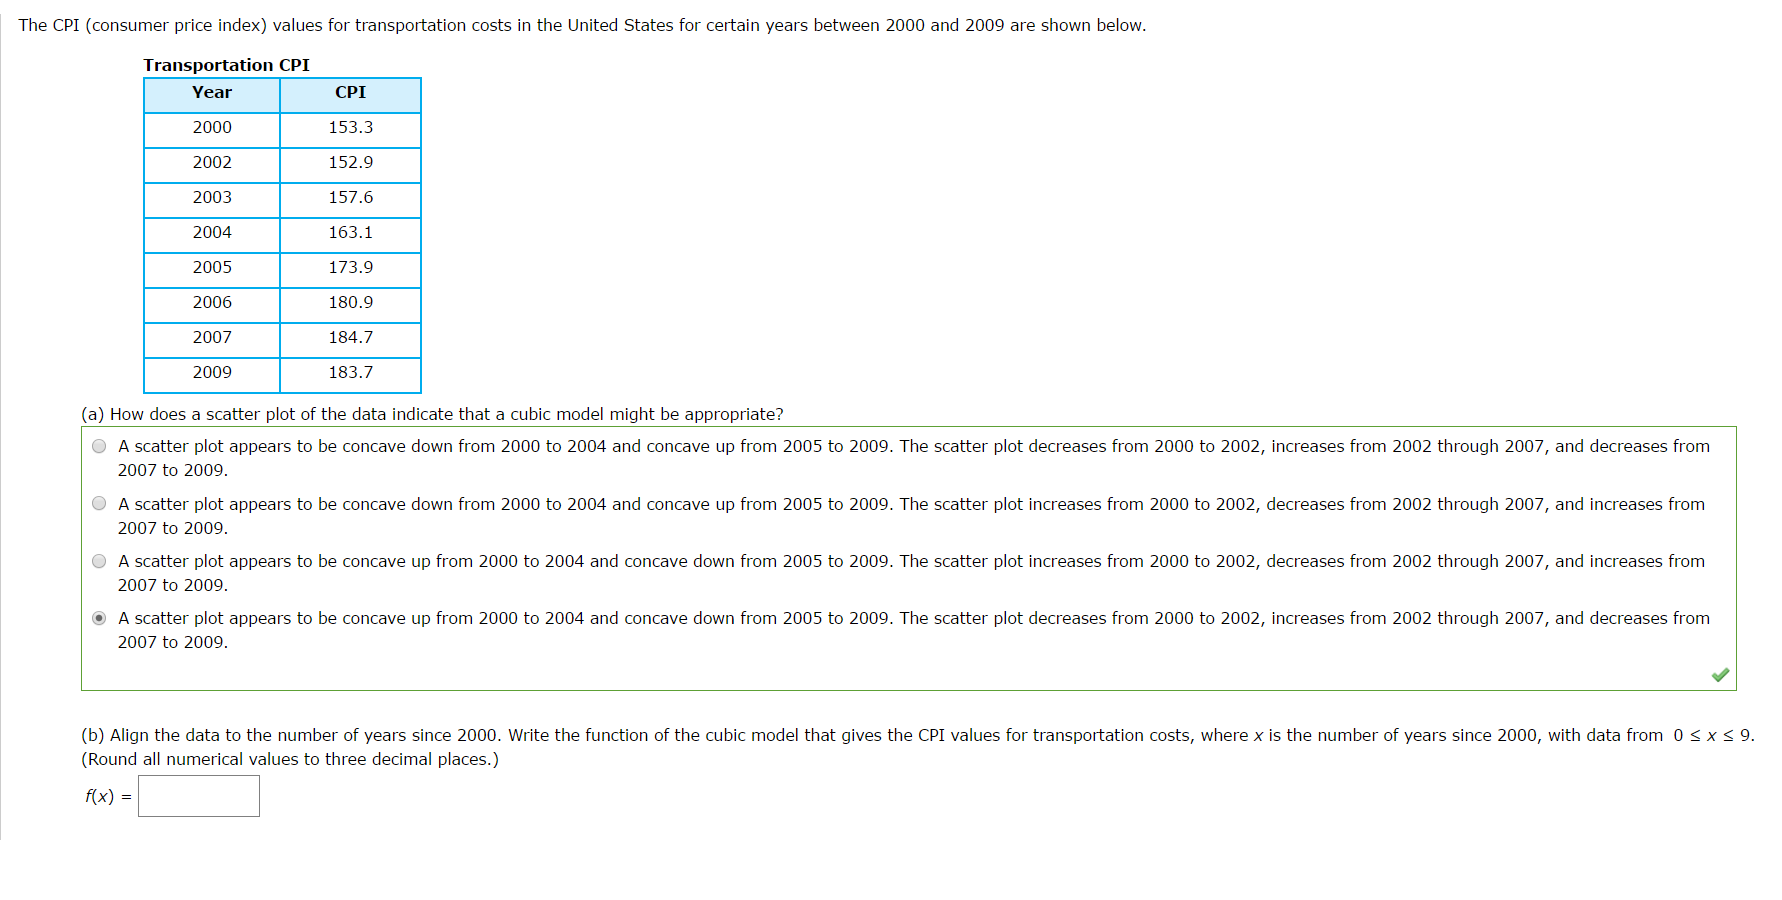
The CPI (consumer price index) values for transportation costs in the United States for certain years between 2000 and 2009 are shown below. Transportation CPI
CPI 153.3
152.9
157.6
163.1
173.9
180.9
184.7
183.7 (a) How does a scatter plot of the data indicate that a cubic model might be appropriate? O A scatter plot appears to be concave down from 2000 to 2004 and concave up from 2005 to 2009. The scatter plot decreases from 2000 to 2002, increases from 2002 through 2007, and decreases from
2007 to 2009. O A scatter plot appears to be concave down from 2000 to 2004 and concave up from 2005 to 2009. The scatter plot increases from 2000 to 2002, decreases from 2002 through 2007, and increases from
2007 to 2009. O A scatter plot appears to be concave up from 2000 to 2004 and concave down from 2005 to 2009. The scatter plot increases from 2000 to 2002, decreases from 2002 through 2007, and increases from
2007 to 2009. LI) A scatter plot appears to be concave up from 2000 to 2004 and concave down from 2005 to 2009. The scatter plot decreases from 2000 to 2002, increases from 2002 through 2007, and decreases from
2007 to 2009. 'I (b) Align the data to the number of years since 2000. Write the function of the cubic model that gives the CPI values for transportation costs, where x is the number of years since 2000, with data from 0 S x S 9.
(Round all numerical values to three decimal places.) ’¼üx} :