
SuperTutor
$15/per page/Negotiable
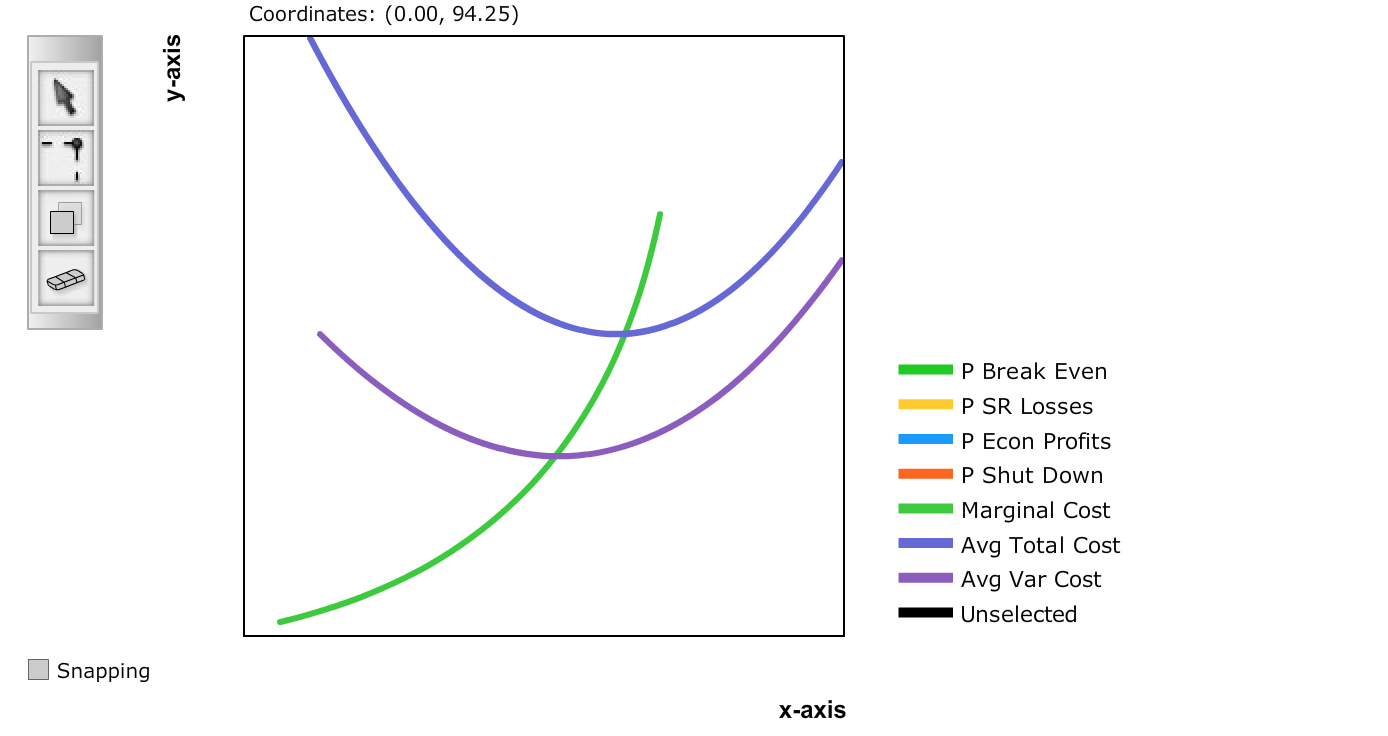
In this graph you see the cost curves for a competitive firm in the short run. There are three curves: average total cost, average variable cost, and marginal cost.Â
Â
Part 1: Use the double-drop line tool to show a price-quantity combination that would yield positive economic profits for the firm and label it P econ profits.Â
Â
Part 2. Use the double-drop line tool to show a price-quantity combination that would yield zero economic profits for the firm and label it as P break even.Â
Â
Part 3. Use the double-drop line tool to show a price-quantity combination that would yield negative economic profits for the firm, but where the firm would stay in business in the short run and label it P SR losses.Â
Â
Part 4. Use the double-drop line tool to show the lowest price-quantity combination at which the firm would continue to produce output and label it P Shut down.