
SophiaPretty
$14/per page/Negotiable
I am confused with this excel assignment. Please upload the excel solution if possible. Thank you.
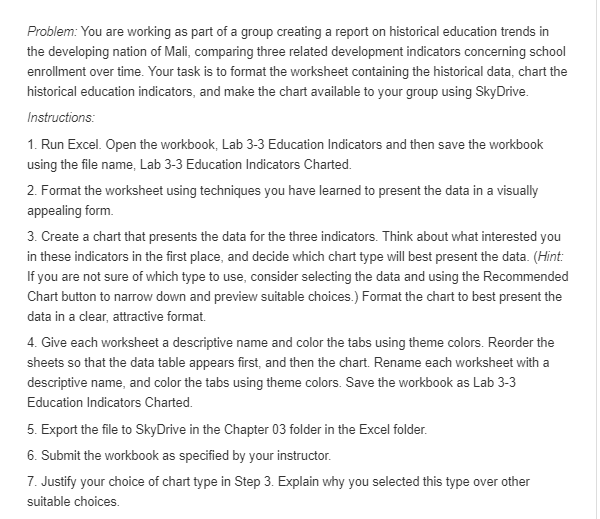
Problem: You are working as part of a group creating a report on historical education trends in
the developing nation of Mali. comparing three related development indicators concerning school
enrollment over time. Your task is to format the worksheet containing the historical data. chart the
historical education indicators. and make the chart available to your group using SkyDIive. Instructions: ŌĆś1. Run Excel. lIIIIpen the wo rkbook, Lab 3-3 Education Indicators and then save the workbook
using the ’¼üle name, Lab 3-3 Education Indicators lCharted. 2. Format the worksheet using techniques you have learned to present the data in a visually
appealing form. 3. Create a chart that presents the data for the three indicators. Think about what interested you
in these indicators in the ’¼ürst place. and decide which chart type will best present the data. {Hint
If you are not sure of which type to use. consider selecting the data and using the Recommended
Chart button to narrow down and preview suitable choices} Format the chart to best present the
data in a clear, attractive format. 4. Give each worksheet a descriptive name and color the tabs using theme colors. Reorder the
sheets so that the data table appears ’¼ürst. and then the chart. Rename each worksheet with a
descriptive name. and color the tabs using theme colors. Save the workbook as Lab 3ŌĆö3
Education Indicators lCharted. 5. Export the ’¼üle to SkyDrive in the IChapter [13 folder in the Excel folder. 5. Submit the workbook as speci’¼üed by your instructor. 3". Justify your choice of chart type in Step 3. Explain why you selected this type over other
suitable choices.