
SophiaPretty
$14/per page/Negotiable
Case: Play Ball with R!
You are a big baseball fan, and you enjoy looking at statistics of players and predicting which ones will do well. You have recently learned of a single metric, Weighted Runs Created, wRC+, that attempts to capture a player’s total offensive value (how much they contribute to making runs). A complete explanation of wRC+ is beyond the scope of this class, but in summary, it combines every outcome (single, double, etc.), then adjusts the value to account for certain factors, such as the baseball parks where the player made the hits.
To learn more, go to the following sources:
http://www.fangraphs.com/library/offense/wrc/
http://www.beyondtheboxscore.com/2014/5/26/5743956/sabermetrics-stats-offense-learn-sabermetrics
¬Ý
You are curious to see how standard baseball statistics, such as home runs and runs batted in, correlate to the more complex wRC+ score, so you gather some data. In this case, we study San Francisco Giants catcher Buster Posey. (For you baseball fans out there, I admit this is a dubious use of wRC+, but I still think it is an interesting statistical exercise)
¬Ý
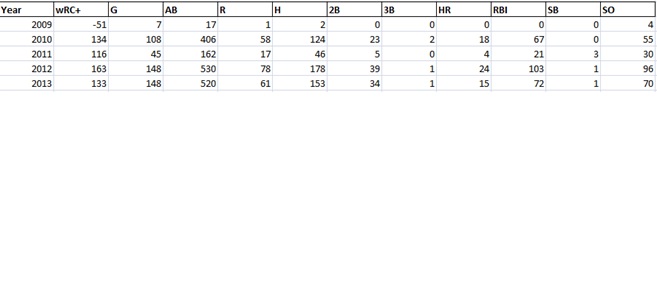
See the associated dataset for the case, “DataScience_7_Case_Posey.xls”. The screenshot below shows a portion of the data. It shows Buster Posey’s batting performance from 2009 (the year he started with the Giants) to 2013.
¬Ý
¬Ý
1. Using the data in the case, construct a vector called “RBI” composed of the runs batted in by Buster Posey between 2009 and 2013 (i.e., 0, 67, 21, 103, 72). Find the mean, median, and range of the vector. Present the answers in an Adobe PDF or Microsoft Word document, including screenshots of your work in R.
¬Ý
2. Read the entire dataset into R as a CSV file. Include the statement to read in the file, as well as a printout of the results to ensure the data was read in correctly. Present the answers in an Adobe PDF or Microsoft Word document, including screenshots of your work in R.
¬Ý
3. Use regression analysis to study the relationship between wRC+ and the common batting statistics Runs (R), Hits (H), and Runs Batted In (RBI). Designate wRC+ as the dependent¬Ý
Attachments: