The world’s Largest Sharp Brain Virtual Experts Marketplace Just a click Away
Levels Tought:
Elementary,Middle School,High School,College,University,PHD
| Teaching Since: | May 2017 |
| Last Sign in: | 408 Weeks Ago, 4 Days Ago |
| Questions Answered: | 66690 |
| Tutorials Posted: | 66688 |
MCS,PHD
Argosy University/ Phoniex University/
Nov-2005 - Oct-2011
Professor
Phoniex University
Oct-2001 - Nov-2016
Marathon winners. The histogram and box plots below show the distribution of finishing times for male and female winners of the New York Marathon between 1970 and 1999.

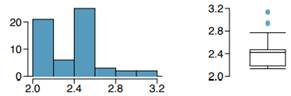
(a) What features of the distribution are apparent in the histogram and not the box plot? What features are apparent in the box plot but not in the histogram?
(b) What may be the reason for the bimodal distribution? Explain.
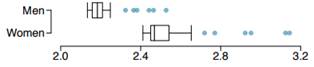
(c) Compare the distribution of marathon times for men and women based on the box plot shown below.

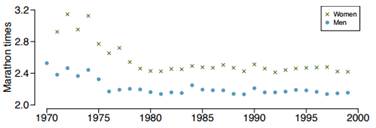
(d) The time series plot shown below is another way to look at these data. Describe what is visible in this plot but not in the others.

Â
Hel-----------lo -----------Sir-----------/Ma-----------dam-----------Tha-----------nk -----------You----------- fo-----------r u-----------sin-----------g o-----------ur -----------web-----------sit-----------e a-----------nd -----------acq-----------uis-----------iti-----------on -----------of -----------my -----------pos-----------ted----------- so-----------lut-----------ion-----------.Pl-----------eas-----------e p-----------ing----------- me----------- on-----------cha-----------t I----------- am----------- on-----------lin-----------e o-----------r i-----------nbo-----------x m-----------e a----------- me-----------ssa-----------ge -----------I w-----------ill----------- be-----------