The world’s Largest Sharp Brain Virtual Experts Marketplace Just a click Away
Levels Tought:
Elementary,Middle School,High School,College,University,PHD
| Teaching Since: | May 2017 |
| Last Sign in: | 408 Weeks Ago, 1 Day Ago |
| Questions Answered: | 66690 |
| Tutorials Posted: | 66688 |
MCS,PHD
Argosy University/ Phoniex University/
Nov-2005 - Oct-2011
Professor
Phoniex University
Oct-2001 - Nov-2016
Construct a Larson-Miller plot using the following creep rupture data, assuming C = 20.

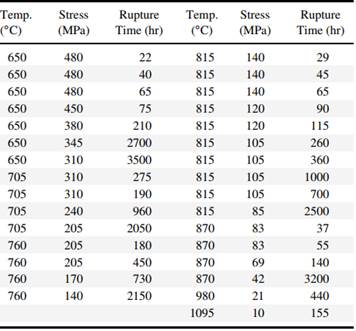
a. Plot the data twice: (i) with axes of Stress vs. the LM parameter in thousands of hours, and (ii) with axes of Log(Stress) vs. the LM parameter in thousands of hours. Fit a second-order polynomial to the second plot.
b. Using your fitted line, determine the expected life for a sample tested with a stress of 240 MPa at 650°C, and with a stress of 35 MPa at 870°C. (This may be easiest if you add a curve to the first plot based on the polynomial fit to the log(stress) data.)
c. What is the maximum operational temperature such that failure should not occur in 5000 hr at stress levels of 140 and 420 MPa, respectively?
Hel-----------lo -----------Sir-----------/Ma-----------dam-----------Tha-----------nk -----------You----------- fo-----------r u-----------sin-----------g o-----------ur -----------web-----------sit-----------e a-----------nd -----------acq-----------uis-----------iti-----------on -----------of -----------my -----------pos-----------ted----------- so-----------lut-----------ion-----------.Pl-----------eas-----------e p-----------ing----------- me----------- on-----------cha-----------t I----------- am----------- on-----------lin-----------e o-----------r i-----------nbo-----------x m-----------e a----------- me-----------ssa-----------ge -----------I w-----------ill----------- be-----------