The world’s Largest Sharp Brain Virtual Experts Marketplace Just a click Away
Levels Tought:
Elementary,Middle School,High School,College,University,PHD
| Teaching Since: | May 2017 |
| Last Sign in: | 408 Weeks Ago, 3 Days Ago |
| Questions Answered: | 66690 |
| Tutorials Posted: | 66688 |
MCS,PHD
Argosy University/ Phoniex University/
Nov-2005 - Oct-2011
Professor
Phoniex University
Oct-2001 - Nov-2016
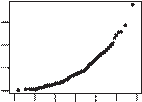
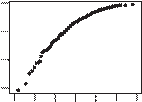
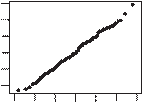
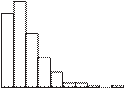
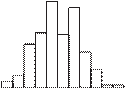
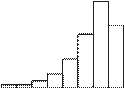
4.4.2Â Â Â Â Â The following three normal probability plots, (a), (b), and (c), were generated from the distributions shown by histograms I, II, and III. Which normal probability plot goes with which histogram? How do you know?
Â
Â
Â
        Â
         
Â
![]()
![]()
Normal scores (a)
Â
Normal scores (b)
Â
Normal scores (c)
Â
Â
Â
              Â
               
Â
YÂ Â Â Â Â Â Â Â Â Â Â Â Â Â Â Â Â Â Â Â Â Â Â Â Â Â Â Â Â Â Â Â Â Â Â Â Â Â Â Â Â Â Â Â Â Â Â Â Â Â Â Â Â Â YÂ Â Â Â Â Â Â Â Â Â Â Â Â Â Â Â Â Â Â Â Â Â Â Â Â Â Â Â Â Â Â Â Â Â Â Â Â Â Â Â Â Â Â Â Â Â Â Â Â Â Â Â Â Â Y
Â
IÂ Â Â Â Â Â Â Â Â Â Â Â Â Â Â Â Â Â Â Â Â Â Â Â Â Â Â Â Â Â Â Â Â Â Â Â Â Â Â Â Â Â Â Â Â Â Â Â Â Â Â Â Â Â Â IIÂ Â Â Â Â Â Â Â Â Â Â Â Â Â Â Â Â Â Â Â Â Â Â Â Â Â Â Â Â Â Â Â Â Â Â Â Â Â Â Â Â Â Â Â Â Â Â Â Â Â Â Â Â III
Â
Hel-----------lo -----------Sir-----------/Ma-----------dam-----------Tha-----------nk -----------You----------- fo-----------r u-----------sin-----------g o-----------ur -----------web-----------sit-----------e a-----------nd -----------acq-----------uis-----------iti-----------on -----------of -----------my -----------pos-----------ted----------- so-----------lut-----------ion-----------.Pl-----------eas-----------e p-----------ing----------- me----------- on-----------cha-----------t I----------- am----------- on-----------lin-----------e o-----------r i-----------nbo-----------x m-----------e a----------- me-----------ssa-----------ge -----------I w-----------ill----------- be-----------