
Maurice Tutor
$15/per page/Negotiable
A group of researchers has devised a stress questionnaire consisting of 15 life events. They are interested in determining whether there is cross-cultural agreement on the relative amount of adjustment each event entails. The questionnaire is given to 300 Americans and 300 Italians. Each individual is instructed to use the event of ‚Äúmarriage‚ÄĚ as the standard and to judge each of the other life events in relation to the adjustment required in marriage. Marriage is arbitrarily given a value of 50 points. If an event is judged to require greater adjustment than marriage, the event should receive more than 50 points. How many more points depends on how much more adjustment is required. After each subject within each culture has assigned points to the 15 life events, the points for each event are averaged. The results are shown in the following table.
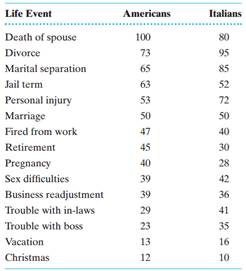
 
a. Assume the data are at least of interval scaling and compute the correlation between the American and Italian ratings.
b. Assume the data are only of ordinal scaling and compute the correlation between ratings of the two cultures. clinical, health 20. Given the following set of paired scores from five subjects:
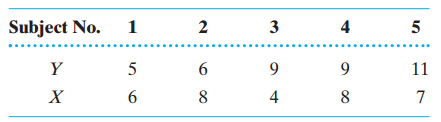
a. Construct a scatter plot of the data.
b. Compute the value of Pearson r.
c. Add the following paired scores from a sixth subject to the data: Y = 26, X =25.
d. Construct another scatter plot, this time for the six paired scores.
e. Compute the value of Pearson r for the six paired scores.
f. Is there much of a difference between your answers for parts b and e? Explain the difference.