The world’s Largest Sharp Brain Virtual Experts Marketplace Just a click Away
Levels Tought:
Elementary,Middle School,High School,College,University,PHD
| Teaching Since: | May 2017 |
| Last Sign in: | 408 Weeks Ago, 4 Days Ago |
| Questions Answered: | 66690 |
| Tutorials Posted: | 66688 |
MCS,PHD
Argosy University/ Phoniex University/
Nov-2005 - Oct-2011
Professor
Phoniex University
Oct-2001 - Nov-2016
What is the process capability of:
(a) Exercise 2?
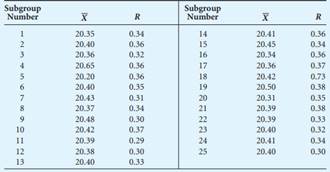
Control charts for X and R are to be established on a certain dimension part, measured in millimeters. Data were collected in subgroup sizes of 6 and are given below. Determine the trial central line and control limits. Assume assignable causes and revise the central line and limits.

(b) Exercise 5?
How do the control limits compare? 5. Control charts for X and R are kept on the weight in kilograms of a color pigment for a batch process. After 25 subgroups with a subgroup size of 4, gX = 52.08 kg (114.8 lb), gR = 11.82 kg (26.1 lb). Assuming the process is in a state of control, compute the X and R chart central line and control limits for the next production period.
Hel-----------lo -----------Sir-----------/Ma-----------dam-----------Tha-----------nk -----------You----------- fo-----------r u-----------sin-----------g o-----------ur -----------web-----------sit-----------e a-----------nd -----------acq-----------uis-----------iti-----------on -----------of -----------my -----------pos-----------ted----------- so-----------lut-----------ion-----------.Pl-----------eas-----------e p-----------ing----------- me----------- on-----------cha-----------t I----------- am----------- on-----------lin-----------e o-----------r i-----------nbo-----------x m-----------e a----------- me-----------ssa-----------ge -----------I w-----------ill----------- be-----------