The world’s Largest Sharp Brain Virtual Experts Marketplace Just a click Away
Levels Tought:
Elementary,Middle School,High School,College,University,PHD
| Teaching Since: | May 2017 |
| Last Sign in: | 398 Weeks Ago, 3 Days Ago |
| Questions Answered: | 66690 |
| Tutorials Posted: | 66688 |
MCS,PHD
Argosy University/ Phoniex University/
Nov-2005 - Oct-2011
Professor
Phoniex University
Oct-2001 - Nov-2016
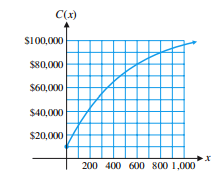
Cost analysis. The total cost (in dollars) of producing x laser printers per week is shown in the figure. Which is greater, the approximate cost of producing the 201st printer or the approximate cost of producing the 601st printer? Does this graph represent a manufacturing process that is becoming more efficient or less efficient as production levels increase? Explain.

Hel-----------lo -----------Sir-----------/Ma-----------dam-----------Tha-----------nk -----------You----------- fo-----------r u-----------sin-----------g o-----------ur -----------web-----------sit-----------e a-----------nd -----------acq-----------uis-----------iti-----------on -----------of -----------my -----------pos-----------ted----------- so-----------lut-----------ion-----------.Pl-----------eas-----------e p-----------ing----------- me----------- on-----------cha-----------t I----------- am----------- on-----------lin-----------e o-----------r i-----------nbo-----------x m-----------e a----------- me-----------ssa-----------ge -----------I w-----------ill----------- be-----------