Maurice Tutor

(5)

$15/per page/Negotiable

About Maurice Tutor

Levels Tought:
Elementary,Middle School,High School,College,University,PHD

Expertise:
Algebra,Applied Sciences See all
Algebra,Applied Sciences,Biology,Calculus,Chemistry,Economics,English,Essay writing,Geography,Geology,Health & Medical,Physics,Science Hide all
Teaching Since: May 2017
Last Sign in: 408 Weeks Ago, 2 Days Ago
Questions Answered: 66690
Tutorials Posted: 66688

Education

  • MCS,PHD
    Argosy University/ Phoniex University/
    Nov-2005 - Oct-2011

Experience

  • Professor
    Phoniex University
    Oct-2001 - Nov-2016

Category > Management Posted 24 Jan 2018 My Price 7.00

USA Today

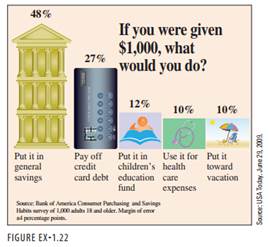
Figure EX-1.22 is a graph similar to one that appeared in USA Today (June 29, 2009). This graph is meant to be a bar graph of responses to the question shown in the graph.

a. Is response to the question a categorical or numerical variable?

b. Explain why a bar chart rather than a dotplot was used to display the response data.

c. There must have been an error made in constructing this graph. How can you tell that the graph is not a correct representation of the response data?

Answers

(5)
Status NEW Posted 24 Jan 2018 08:01 PM My Price 7.00

Hel-----------lo -----------Sir-----------/Ma-----------dam-----------Tha-----------nk -----------You----------- fo-----------r u-----------sin-----------g o-----------ur -----------web-----------sit-----------e a-----------nd -----------acq-----------uis-----------iti-----------on -----------of -----------my -----------pos-----------ted----------- so-----------lut-----------ion-----------.Pl-----------eas-----------e p-----------ing----------- me----------- on-----------cha-----------t I----------- am----------- on-----------lin-----------e o-----------r i-----------nbo-----------x m-----------e a----------- me-----------ssa-----------ge -----------I w-----------ill----------- be-----------

Not Rated(0)