The world’s Largest Sharp Brain Virtual Experts Marketplace Just a click Away
Levels Tought:
Elementary,Middle School,High School,College,University,PHD
| Teaching Since: | May 2017 |
| Last Sign in: | 408 Weeks Ago, 2 Days Ago |
| Questions Answered: | 66690 |
| Tutorials Posted: | 66688 |
MCS,PHD
Argosy University/ Phoniex University/
Nov-2005 - Oct-2011
Professor
Phoniex University
Oct-2001 - Nov-2016
Refer to the previous question. A manufacturing engineer for MPI collected the following data on the failure rates of components X, Y, and Z in a random sample of 1,000 circuit boards:
Â

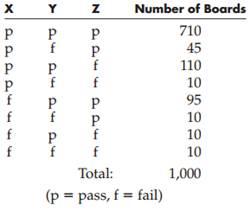
For example, the first row in this table indicates that components X, Y, and Z all passed their inspections in 710 out of the 1,000 boards checked. The second row indicates that 45 boards passed inspection on components X and Z but failed on component Y. The remaining rows can be interpreted similarly.
a. Using this data, compute conditional probabilities for the decision tree you developed.
b. According to the revised probabilities, in which order should the components be tested?
c. What is the expected cost of performing the tests in this sequence?
Hel-----------lo -----------Sir-----------/Ma-----------dam-----------Tha-----------nk -----------You----------- fo-----------r u-----------sin-----------g o-----------ur -----------web-----------sit-----------e a-----------nd -----------acq-----------uis-----------iti-----------on -----------of -----------my -----------pos-----------ted----------- so-----------lut-----------ion-----------.Pl-----------eas-----------e p-----------ing----------- me----------- on-----------cha-----------t I----------- am----------- on-----------lin-----------e o-----------r i-----------nbo-----------x m-----------e a----------- me-----------ssa-----------ge -----------I w-----------ill----------- be-----------