The world’s Largest Sharp Brain Virtual Experts Marketplace Just a click Away
Levels Tought:
Elementary,Middle School,High School,College,University,PHD
| Teaching Since: | May 2017 |
| Last Sign in: | 408 Weeks Ago, 2 Days Ago |
| Questions Answered: | 66690 |
| Tutorials Posted: | 66688 |
MCS,PHD
Argosy University/ Phoniex University/
Nov-2005 - Oct-2011
Professor
Phoniex University
Oct-2001 - Nov-2016
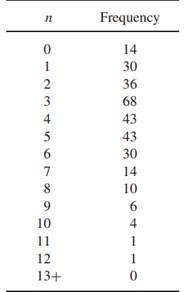
The Poisson distribution has been used by traffic engineers as a model for light traffic, based on the rationale that if the rate is approximately constant and the traffic is light (so the individual cars move independently of each other), the distribution of counts of cars in a given time interval or space area should be nearly Poisson (Gerlough and Schuhl 1955). The following table shows the number of right turns during 300 3-min intervals at a specific intersection. Fit a Poisson distribution. Comment on the fit by comparing observed and expected counts. It is useful to know that the 300 intervals were distributed over various hours of the day and various days of the week.

Â
Hel-----------lo -----------Sir-----------/Ma-----------dam-----------Tha-----------nk -----------You----------- fo-----------r u-----------sin-----------g o-----------ur -----------web-----------sit-----------e a-----------nd -----------acq-----------uis-----------iti-----------on -----------of -----------my -----------pos-----------ted----------- so-----------lut-----------ion-----------.Pl-----------eas-----------e p-----------ing----------- me----------- on-----------cha-----------t I----------- am----------- on-----------lin-----------e o-----------r i-----------nbo-----------x m-----------e a----------- me-----------ssa-----------ge -----------I w-----------ill----------- be-----------