The world’s Largest Sharp Brain Virtual Experts Marketplace Just a click Away
Levels Tought:
Elementary,Middle School,High School,College,University,PHD
| Teaching Since: | May 2017 |
| Last Sign in: | 408 Weeks Ago, 1 Day Ago |
| Questions Answered: | 66690 |
| Tutorials Posted: | 66688 |
MCS,PHD
Argosy University/ Phoniex University/
Nov-2005 - Oct-2011
Professor
Phoniex University
Oct-2001 - Nov-2016
Refer to the data from Exercise 18.
a. Create an effects plot of the data.
b. Use Tukey’s multiple comparisons procedure to determine which groups differ from one another with respect to CS activity.
Exercise 18
The accompanying summary data on skeletalmuscle citrate synthase activity (nmol/min/mg) appeared in the article “Impact of Lifelong Sedentary Behavior on Mitochondrial Function of Mice Skeletal Muscle” (J. of Gerontology, 2009: 927–939):

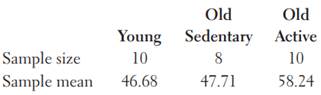
Suppose that the total sum of squares for the experimental data is SST = 2116.81.
a. Construct an ANOVA table for this experiment.
b. Using
= .05, can you conclude that true average activity differs for the three groups?
Hel-----------lo -----------Sir-----------/Ma-----------dam-----------Tha-----------nk -----------You----------- fo-----------r u-----------sin-----------g o-----------ur -----------web-----------sit-----------e a-----------nd -----------acq-----------uis-----------iti-----------on -----------of -----------my -----------pos-----------ted----------- so-----------lut-----------ion-----------.Pl-----------eas-----------e p-----------ing----------- me----------- on-----------cha-----------t I----------- am----------- on-----------lin-----------e o-----------r i-----------nbo-----------x m-----------e a----------- me-----------ssa-----------ge -----------I w-----------ill----------- be-----------