Maurice Tutor

(5)

$15/per page/Negotiable

About Maurice Tutor

Levels Tought:
Elementary,Middle School,High School,College,University,PHD

Expertise:
Algebra,Applied Sciences See all
Algebra,Applied Sciences,Biology,Calculus,Chemistry,Economics,English,Essay writing,Geography,Geology,Health & Medical,Physics,Science Hide all
Teaching Since: May 2017
Last Sign in: 408 Weeks Ago, 1 Day Ago
Questions Answered: 66690
Tutorials Posted: 66688

Education

  • MCS,PHD
    Argosy University/ Phoniex University/
    Nov-2005 - Oct-2011

Experience

  • Professor
    Phoniex University
    Oct-2001 - Nov-2016

Category > Management Posted 03 Feb 2018 My Price 5.00

fatigue test data

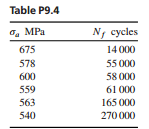
The steel 50CrMo4 can be assumed to have an S-N curve of the form of Eq. 9.6. Some fatigue test data for unnotched specimens under axial stress, with zero mean stress, are given in Table P9.4.

(a) Plot these data on log–log coordinates, and determine approximate values for the constants A and B.

(b) Obtain refined values for A and B, using a linear least-squares fit to log N f versus log σa. Then calculate  and b for Eq. 9.7.

Answers

(5)
Status NEW Posted 03 Feb 2018 07:02 PM My Price 5.00

Hel-----------lo -----------Sir-----------/Ma-----------dam-----------Tha-----------nk -----------You----------- fo-----------r u-----------sin-----------g o-----------ur -----------web-----------sit-----------e a-----------nd -----------acq-----------uis-----------iti-----------on -----------of -----------my -----------pos-----------ted----------- so-----------lut-----------ion-----------.Pl-----------eas-----------e p-----------ing----------- me----------- on-----------cha-----------t I----------- am----------- on-----------lin-----------e o-----------r i-----------nbo-----------x m-----------e a----------- me-----------ssa-----------ge -----------I w-----------ill----------- be-----------

Not Rated(0)