The world’s Largest Sharp Brain Virtual Experts Marketplace Just a click Away
Levels Tought:
Elementary,Middle School,High School,College,University,PHD
| Teaching Since: | May 2017 |
| Last Sign in: | 406 Weeks Ago, 6 Days Ago |
| Questions Answered: | 66690 |
| Tutorials Posted: | 66688 |
MCS,PHD
Argosy University/ Phoniex University/
Nov-2005 - Oct-2011
Professor
Phoniex University
Oct-2001 - Nov-2016
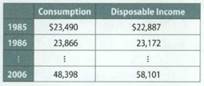
The consumption function captures one of the key relationships in economics that was first developed by john Maynard Keynes. It expresses consumption as a function of disposable income, where disposable income is income after taxes. The table below shows a portion of average U.S. annual consumption and disposable income for the years 1985-2006. The complete data set can be found on the text website, labeled Consumption function.
Â

When estimating the model: Consumption = β0 + β1 Disposable Income + ε, the following output is produced.

a. Use Excel to replicate the above regression output.
b. What is the sample regression equation?
c. In this model the slope coefficient is called the margin a l propensity to consume. Interpret its meaning.
d. What is predicted consumption if disposable income is $57,000?
Â
Hel-----------lo -----------Sir-----------/Ma-----------dam-----------Tha-----------nk -----------You----------- fo-----------r u-----------sin-----------g o-----------ur -----------web-----------sit-----------e a-----------nd -----------acq-----------uis-----------iti-----------on -----------of -----------my -----------pos-----------ted----------- so-----------lut-----------ion-----------.Pl-----------eas-----------e p-----------ing----------- me----------- on-----------cha-----------t I----------- am----------- on-----------lin-----------e o-----------r i-----------nbo-----------x m-----------e a----------- me-----------ssa-----------ge -----------I w-----------ill----------- be-----------