The world’s Largest Sharp Brain Virtual Experts Marketplace Just a click Away
Levels Tought:
Elementary,Middle School,High School,College,University,PHD
| Teaching Since: | May 2017 |
| Last Sign in: | 408 Weeks Ago |
| Questions Answered: | 66690 |
| Tutorials Posted: | 66688 |
MCS,PHD
Argosy University/ Phoniex University/
Nov-2005 - Oct-2011
Professor
Phoniex University
Oct-2001 - Nov-2016
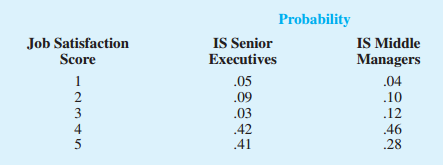
The following probability distributions of job satisfaction scores for a sample of information systems (IS) senior executives and middle managers range from a low of 1 (very dissatisfied) to a high of 5 (very satisfied).
Â

Â
a. What is the expected value of the job satisfaction score for senior executives?
b. What is the expected value of the job satisfaction score for middle managers?
c. Compute the variance of job satisfaction scores for executives and middle managers.
d. Compute the standard deviation of job satisfaction scores for both probability distributions.
e. Compare the overall job satisfaction of senior executives and middle managers.
Â
Hel-----------lo -----------Sir-----------/Ma-----------dam-----------Tha-----------nk -----------You----------- fo-----------r u-----------sin-----------g o-----------ur -----------web-----------sit-----------e a-----------nd -----------acq-----------uis-----------iti-----------on -----------of -----------my -----------pos-----------ted----------- so-----------lut-----------ion-----------.Pl-----------eas-----------e p-----------ing----------- me----------- on-----------cha-----------t I----------- am----------- on-----------lin-----------e o-----------r i-----------nbo-----------x m-----------e a----------- me-----------ssa-----------ge -----------I w-----------ill----------- be-----------