The world’s Largest Sharp Brain Virtual Experts Marketplace Just a click Away
Levels Tought:
Elementary,Middle School,High School,College,University,PHD
| Teaching Since: | May 2017 |
| Last Sign in: | 407 Weeks Ago, 6 Days Ago |
| Questions Answered: | 66690 |
| Tutorials Posted: | 66688 |
MCS,PHD
Argosy University/ Phoniex University/
Nov-2005 - Oct-2011
Professor
Phoniex University
Oct-2001 - Nov-2016
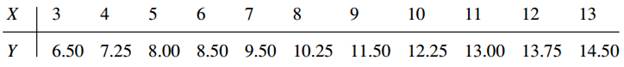
In production flow-shop problems, performance is often evaluated by minimum make span, this being the total elapsed time from starting the first job on the first machine until the last job is completed on the last machine. We might expect that minimum make span would be linearly related, at least approximately, to the number of jobs. Consider the following data, with X denoting the number of jobs and Y denoting the minimum make span in hours:
Â

(a) From the standpoint of engineering economics, what would a nonlinear relationship signify?
(b) What does a scatter plot of the data suggest about the relationship?
(c) If appropriate, fit a simple linear regression model to the data and estimate the increase in the minimum make span for each additional job. If doing this would be inappropriate, explain why.
Hel-----------lo -----------Sir-----------/Ma-----------dam-----------Tha-----------nk -----------You----------- fo-----------r u-----------sin-----------g o-----------ur -----------web-----------sit-----------e a-----------nd -----------acq-----------uis-----------iti-----------on -----------of -----------my -----------pos-----------ted----------- so-----------lut-----------ion-----------.Pl-----------eas-----------e p-----------ing----------- me----------- on-----------cha-----------t I----------- am----------- on-----------lin-----------e o-----------r i-----------nbo-----------x m-----------e a----------- me-----------ssa-----------ge -----------I w-----------ill----------- be-----------