The world’s Largest Sharp Brain Virtual Experts Marketplace Just a click Away
Levels Tought:
Elementary,Middle School,High School,College,University,PHD
| Teaching Since: | May 2017 |
| Last Sign in: | 398 Weeks Ago, 1 Day Ago |
| Questions Answered: | 66690 |
| Tutorials Posted: | 66688 |
MCS,PHD
Argosy University/ Phoniex University/
Nov-2005 - Oct-2011
Professor
Phoniex University
Oct-2001 - Nov-2016
Â
This project involves determining the best-fit polynomial approximating curve to the H vs. Q data obtained experimentally. The experimental H vs. Q data are shown in Table P9.1


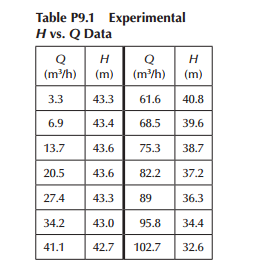
Try degrees polynomials of 2 through 4 to determine which degree polynomial will give the smallest MSE. Use MATLAB’s function polyfit, which returns the coefficients for each of the 3 polynomials. Then use MATLAB’s function polyval to create for each polynomial:
 a. A table containing Q, H, and Hc, where Hc are values from the approximating curve for H vs. Q
b. A plot containing both Hc vs. Q (solid line) and H vs. Q (small circles)
Â
Â
Hel-----------lo -----------Sir-----------/Ma-----------dam-----------Tha-----------nk -----------You----------- fo-----------r u-----------sin-----------g o-----------ur -----------web-----------sit-----------e a-----------nd -----------acq-----------uis-----------iti-----------on -----------of -----------my -----------pos-----------ted----------- so-----------lut-----------ion-----------.Pl-----------eas-----------e p-----------ing----------- me----------- on-----------cha-----------t I----------- am----------- on-----------lin-----------e o-----------r i-----------nbo-----------x m-----------e a----------- me-----------ssa-----------ge -----------I w-----------ill----------- be-----------