The world’s Largest Sharp Brain Virtual Experts Marketplace Just a click Away
Levels Tought:
Elementary,Middle School,High School,College,University,PHD
| Teaching Since: | May 2017 |
| Last Sign in: | 407 Weeks Ago, 6 Days Ago |
| Questions Answered: | 66690 |
| Tutorials Posted: | 66688 |
MCS,PHD
Argosy University/ Phoniex University/
Nov-2005 - Oct-2011
Professor
Phoniex University
Oct-2001 - Nov-2016
Price demand. A company manufactures memory chips for microcomputers. Its marketing research department, using statistical techniques, collected the data shown in Table 8, where p is the wholesale price per chip at which x million chips can be sold. Using special analytical techniques (regression analysis), an analyst produced the following price demand function to model the data:

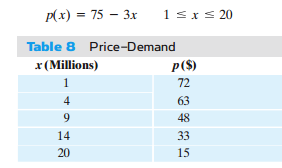
(A) Plot the data points in Table 8, and sketch a graph of the price demand function in the same coordinate system.
(B) What would be the estimated price per chip for a demand of 7 million chips? For a demand of 11 million chips?
Â
Hel-----------lo -----------Sir-----------/Ma-----------dam-----------Tha-----------nk -----------You----------- fo-----------r u-----------sin-----------g o-----------ur -----------web-----------sit-----------e a-----------nd -----------acq-----------uis-----------iti-----------on -----------of -----------my -----------pos-----------ted----------- so-----------lut-----------ion-----------.Pl-----------eas-----------e p-----------ing----------- me----------- on-----------cha-----------t I----------- am----------- on-----------lin-----------e o-----------r i-----------nbo-----------x m-----------e a----------- me-----------ssa-----------ge -----------I w-----------ill----------- be-----------