Maurice Tutor

(5)

$15/per page/Negotiable

About Maurice Tutor

Levels Tought:
Elementary,Middle School,High School,College,University,PHD

Expertise:
Algebra,Applied Sciences See all
Algebra,Applied Sciences,Biology,Calculus,Chemistry,Economics,English,Essay writing,Geography,Geology,Health & Medical,Physics,Science Hide all
Teaching Since: May 2017
Last Sign in: 407 Weeks Ago, 6 Days Ago
Questions Answered: 66690
Tutorials Posted: 66688

Education

  • MCS,PHD
    Argosy University/ Phoniex University/
    Nov-2005 - Oct-2011

Experience

  • Professor
    Phoniex University
    Oct-2001 - Nov-2016

Category > Management Posted 15 Feb 2018 My Price 6.00

diagram of activities

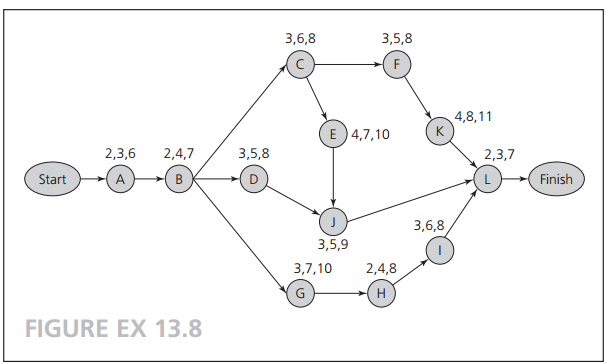
Given the diagram of activities A through L shown in Figure EX 13.8 , with their pessimistic, most likely, and optimistic duration times in weeks:


a. Calculate the mean duration for each activity.

b. Calculate the variance for each activity time.

c. Identify the mean and standard deviation for each path.

d. Calculate the project completion probability for thirty, thirty - one, and thirty - two weeks.


Answers

(5)
Status NEW Posted 15 Feb 2018 06:02 PM My Price 6.00

Hel-----------lo -----------Sir-----------/Ma-----------dam-----------Tha-----------nk -----------You----------- fo-----------r u-----------sin-----------g o-----------ur -----------web-----------sit-----------e a-----------nd -----------acq-----------uis-----------iti-----------on -----------of -----------my -----------pos-----------ted----------- so-----------lut-----------ion-----------.Pl-----------eas-----------e p-----------ing----------- me----------- on-----------cha-----------t I----------- am----------- on-----------lin-----------e o-----------r i-----------nbo-----------x m-----------e a----------- me-----------ssa-----------ge -----------I w-----------ill----------- be-----------

Not Rated(0)