The world’s Largest Sharp Brain Virtual Experts Marketplace Just a click Away
Levels Tought:
Elementary,Middle School,High School,College,University,PHD
| Teaching Since: | May 2017 |
| Last Sign in: | 399 Weeks Ago, 1 Day Ago |
| Questions Answered: | 66690 |
| Tutorials Posted: | 66688 |
MCS,PHD
Argosy University/ Phoniex University/
Nov-2005 - Oct-2011
Professor
Phoniex University
Oct-2001 - Nov-2016
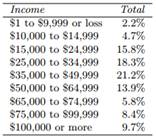
Income and gender. The relative frequency table below displays the distribution of annual total personal income (in 2009 inflation-adjusted dollars) for a representative sample of 96,420,486 Americans. These data come from the American Community Survey for 2005-2009. This sample is comprised of 59% males and 41% females.69
(a) Describe the distribution of total personal income.
(b) What is the probability that a randomly chosen US resident makes less than $50,000 per year?
(c) What is the probability that a randomly chosen US resident makes less than $50,000 per year and is female? Note any assumptions you make.
(d) The same data source indicates that 71.8% of females make less than $50,000 per year. Use this value to determine whether or not the assumption you made in part (c) is valid.

Hel-----------lo -----------Sir-----------/Ma-----------dam-----------Tha-----------nk -----------You----------- fo-----------r u-----------sin-----------g o-----------ur -----------web-----------sit-----------e a-----------nd -----------acq-----------uis-----------iti-----------on -----------of -----------my -----------pos-----------ted----------- so-----------lut-----------ion-----------.Pl-----------eas-----------e p-----------ing----------- me----------- on-----------cha-----------t I----------- am----------- on-----------lin-----------e o-----------r i-----------nbo-----------x m-----------e a----------- me-----------ssa-----------ge -----------I w-----------ill----------- be-----------