The world’s Largest Sharp Brain Virtual Experts Marketplace Just a click Away
Levels Tought:
Elementary,Middle School,High School,College,University,PHD
| Teaching Since: | May 2017 |
| Last Sign in: | 399 Weeks Ago, 1 Day Ago |
| Questions Answered: | 66690 |
| Tutorials Posted: | 66688 |
MCS,PHD
Argosy University/ Phoniex University/
Nov-2005 - Oct-2011
Professor
Phoniex University
Oct-2001 - Nov-2016
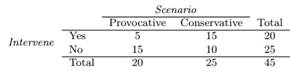
Social experiment, Part I. A “social experiment” conducted by a TV program questioned what people do when they see a very obviously bruised woman getting picked on by her boyfriend. On two different occasions at the same restaurant, the same couple was depicted. In one scenario the woman was dressed “provocatively” and in the other scenario the woman was dressed “conservatively”. The table below shows how many restaurant diners were present under each scenario, and whether or not they intervened.

Explain why the sampling distribution of the difference between the proportions of interventions under provocative and conservative scenarios does not follow an approximately normal distribution.
Hel-----------lo -----------Sir-----------/Ma-----------dam-----------Tha-----------nk -----------You----------- fo-----------r u-----------sin-----------g o-----------ur -----------web-----------sit-----------e a-----------nd -----------acq-----------uis-----------iti-----------on -----------of -----------my -----------pos-----------ted----------- so-----------lut-----------ion-----------.Pl-----------eas-----------e p-----------ing----------- me----------- on-----------cha-----------t I----------- am----------- on-----------lin-----------e o-----------r i-----------nbo-----------x m-----------e a----------- me-----------ssa-----------ge -----------I w-----------ill----------- be-----------