The world’s Largest Sharp Brain Virtual Experts Marketplace Just a click Away
Levels Tought:
Elementary,Middle School,High School,College,University,PHD
| Teaching Since: | May 2017 |
| Last Sign in: | 398 Weeks Ago, 2 Days Ago |
| Questions Answered: | 66690 |
| Tutorials Posted: | 66688 |
MCS,PHD
Argosy University/ Phoniex University/
Nov-2005 - Oct-2011
Professor
Phoniex University
Oct-2001 - Nov-2016
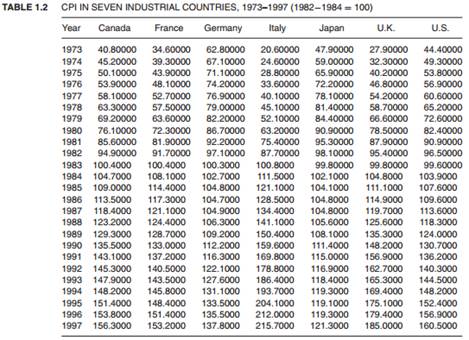
Table 1.2 gives data on the Consumer Price Index (CPI) for seven industrialized countries with 1982–1984 = 100 as the base of the index.
Â
a. From the given data, compute the inflation rate for each country.16
b. Plot the inflation rate for each country against time (i.e., use the horizontal axis for time and the vertical axis for the inflation rate.)
c. What broad conclusions can you draw about the inflation experience in the seven countries?
d. Which country’s inflation rate seems to be most variable? Can you offer any explanation?

Hel-----------lo -----------Sir-----------/Ma-----------dam-----------Tha-----------nk -----------You----------- fo-----------r u-----------sin-----------g o-----------ur -----------web-----------sit-----------e a-----------nd -----------acq-----------uis-----------iti-----------on -----------of -----------my -----------pos-----------ted----------- so-----------lut-----------ion-----------.Pl-----------eas-----------e p-----------ing----------- me----------- on-----------cha-----------t I----------- am----------- on-----------lin-----------e o-----------r i-----------nbo-----------x m-----------e a----------- me-----------ssa-----------ge -----------I w-----------ill----------- be-----------