The world’s Largest Sharp Brain Virtual Experts Marketplace Just a click Away
Levels Tought:
Elementary,Middle School,High School,College,University,PHD
| Teaching Since: | May 2017 |
| Last Sign in: | 399 Weeks Ago |
| Questions Answered: | 66690 |
| Tutorials Posted: | 66688 |
MCS,PHD
Argosy University/ Phoniex University/
Nov-2005 - Oct-2011
Professor
Phoniex University
Oct-2001 - Nov-2016
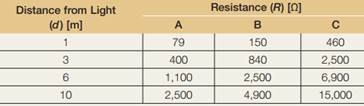
Cadmium sulfide (CdS) is a semiconducting material with a pronounced sensitivity to light—as more light strikes it, its resistance goes down. In real devices, the resistance of a given device may vary over four orders of magnitude or more. An experiment was set up with a single light source in an otherwise dark room. The resistance of three different CdS photo resistors was measured when they were at various distances from the light source. The farther they were from the source, the dimmer the illumination on the photo resistor. Create a proper plot of the data. Use polyfit to determine power model for each data set. For each model, add the trend line and the associated trend line equation to the graph. Use an appropriate location for the equations to clearly associate them with the correct trend line.

Hel-----------lo -----------Sir-----------/Ma-----------dam-----------Tha-----------nk -----------You----------- fo-----------r u-----------sin-----------g o-----------ur -----------web-----------sit-----------e a-----------nd -----------acq-----------uis-----------iti-----------on -----------of -----------my -----------pos-----------ted----------- so-----------lut-----------ion-----------.Pl-----------eas-----------e p-----------ing----------- me----------- on-----------cha-----------t I----------- am----------- on-----------lin-----------e o-----------r i-----------nbo-----------x m-----------e a----------- me-----------ssa-----------ge -----------I w-----------ill----------- be-----------