Maurice Tutor
$15/per page/Negotiable
Refer to the SENIC data set in Appendix C.1. Two models have been proposed for predicting the average length of patient stay in a hospital (Y). Model I utilizes as predictor variables age (X1) infection risk (X2), and available facilities and services (X}). Model II uses as predictor variables number of beds (X)), infection risk (X2), and available facilities and services (X}).
 
a. Prepare a stem-and-Ieaf plot for each of the predictor variables. What information do these plots provide?
b. Obtain the scatter plot matrix and the correlation matrix for each proposed model. Interpret these and state your principal findings.
c. For each of the two proposed models, fit first-order regression model (6.5) with three predictor variables.
d. Calculate R2 for each modeL Is one model clearly preferable in terms of this measure?
e. For each model, obtain the residuals and plot them against Y, each of the three predictor variables, and each of the two-factor interaction terms. Also prepare a normal probability plot of the residuals for each of the two fitted models. Interpret your plots and state your findings. Is one model clearly more appropriate than the other?
Appendix C.l.
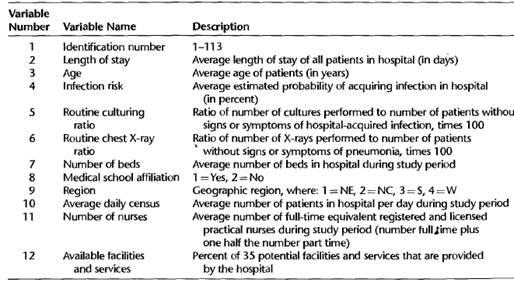
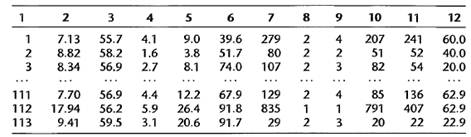
The primary objective of the Study on the Efficacy of Nosocomial Infection Control (SENIC Project) was to determine whether infection surveillance and control programs have reduced the rates of nosocomial (hospital-acquired) infection in United States hospitals. This data set consists of a random sample of 113 hospitals selected from the original 338 hospitals
surveyed. Each line of the data set has an identification number and provides information on 11 other variables for a single hospital. The data presented here are for the 1975-76 study period. The 12 variables are: