
Maurice Tutor
$15/per page/Negotiable
Â
The following table (Cochran 1977) shows the stratification of all farms in a county by farm size and the mean and standard deviation of the number of acres of corn in each stratum.
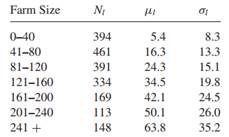
a. For a sample size of 100 farms, compute the sample sizes from each stratum for proportional and optimal allocation, and compare them.
b. Calculate the variances of the sample mean for each allocation and compare them to each other and to the variance of an estimate formed from simple random sampling.
c. What are the population mean and variance?
d. Suppose that ten farms are sampled per stratum. What is ![]() )? How large a simple random sample would have to be taken to attain the same variance? Ignore the finite population correction. e. Repeat part (d) using proportional allocation of the 70 samples.
)? How large a simple random sample would have to be taken to attain the same variance? Ignore the finite population correction. e. Repeat part (d) using proportional allocation of the 70 samples.
Â