The world’s Largest Sharp Brain Virtual Experts Marketplace Just a click Away
Levels Tought:
Elementary,Middle School,High School,College,University,PHD
| Teaching Since: | May 2017 |
| Last Sign in: | 398 Weeks Ago, 2 Days Ago |
| Questions Answered: | 66690 |
| Tutorials Posted: | 66688 |
MCS,PHD
Argosy University/ Phoniex University/
Nov-2005 - Oct-2011
Professor
Phoniex University
Oct-2001 - Nov-2016
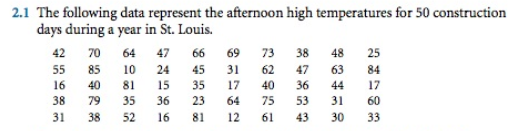
1: Determine the Smallest # & Largest # & Range of these two numbers
Â
Â
2: Decide the number of classes
Â
Â
Â
Â
3: Determine the class interval or width
Â
Â
Â
Â
4: Set the individual class limits
Â
Â
Â
Â
Â
Â
5: Tally 0r count the numbers into the classes and construct the frequency distribution.
Â
Â
Â
Â
Â
Â
6: Construct the Histogram (Bar Chart and Line Chart using/connecting the Midpoint of each class) You can use the back of the page if you want)
Attachments:
Hel-----------lo -----------Sir-----------/Ma-----------dam-----------Tha-----------nk -----------You----------- fo-----------r u-----------sin-----------g o-----------ur -----------web-----------sit-----------e a-----------nd -----------acq-----------uis-----------iti-----------on -----------of -----------my -----------pos-----------ted----------- so-----------lut-----------ion-----------.Pl-----------eas-----------e p-----------ing----------- me----------- on----------- ch-----------at -----------I a-----------m o-----------nli-----------ne -----------or -----------inb-----------ox -----------me -----------a m-----------ess-----------age----------- I -----------wil-----------l b-----------e