
Alpha Geek
$10/per page/Negotiable
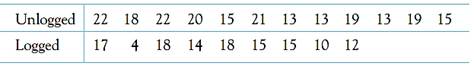
Logging in the rain forest, continued. Use the data in Exercise 19.5 to give a 99% confidence interval for the difference in mean number of species between unlogged and logged plots.
Exercise 19.5:
Logging in the rain forest. “Conservationists have despaired over destruction of tropical rain forest by logging, clearing, and burning.’’ These words begin a report on a statistical study of the effects of logging in Borneo.4 Here are data on the number of tree species in 12 unlogged forest plots and 9 similar plots logged 8 years earlier:
(a) The study report says, “Loggers were unaware that the effects of logging would be assessed.’’ Why is this important? The study report also explains why the plots can be considered to be randomly assigned. (b) Does logging significantly reduce the mean number of species in a plot after 8 years? Follow the four-step process as illustrated in Examples 19.2 and 19.3.
Examples 19.2:
Does peer discussion promote learning? Undergraduate students in a biology class were randomly divided into two groups. In the first group, students worked alone on a multiple-choice exam on material recently covered in the class. In the second group, students worked in teams of four on the same multiple-choice exam. The teams were encouraged to discuss the questions among themselves before answering questions. All exams were graded and returned to the students. Then all students worked alone on another multiple-choice exam on the same material as the first exam. Compare the mean scores of the two groups on the second exam.
Examples 19.3:
Chemical analysis. To check a new analytical method, a chemist obtains a reference specimen of known concentration from the National Institute of Standards and Technology. She then makes 20 measurements of the concentration of this specimen with the new method and checks for bias by comparing the mean result with the known concentration.
Â