
SophiaPretty
$14/per page/Negotiable
Case: Acme Shopping (For R)
 
You are the data scientist for Acme Shopping, a large shopping mall that incorporates a balanced tenancy of different types of stores along with eating areas. To understand your customers better, you conduct a survey to study beliefs on shopping. You test those beliefs by asking shoppers the six questions listed below. Shoppers then answer using a 7-point Likert scale, from 1 (strongly disagree) to 7 (strongly agree). Your goal is to group the shoppers at Acme Shopping into different segments using WardÔÇÖs method. The questions are listed below:
 
V1. Shopping is fun
V2. Shopping is bad for your budget
V3. I combine shopping with eating out
V4. I try to get the best buys while shopping
V5. I don't care about shopping
V6. You can save a lot of money by comparing prices
 
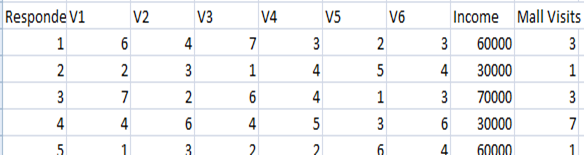
You also collect other data, such as income and number of mall visits. Do not include the other data in your analysis.
 
See the associated dataset for the case, ÔÇťDataScience_8_Case_Shopping.xlsÔÇŁ. The screenshot below shows a portion of the data.┬áThis case closely follows the dog food example in the lecture.
 
 
1.┬áPrepare the data by selecting the subset of the spreadsheet that you need (eliminate any explanatory material in the spreadsheet that is not part of the data). Save the data in comma separated values (CSV) format using the filename ÔÇťacmeshopÔÇŁ. Read the data into R using the read.csv command. Print out the data in R to ensure it was loaded in correctly. Present the answers in an Adobe PDF or Microsoft Word document, including screenshots of your work in R.
 
2.┬áCompute the distances between points in the dataset by using the ÔÇťdistÔÇŁ function. Use the Euclidean method. Next, ask R to compute the hierarchical clusters (hclust), based on the distance matrix you found in the previous step. Present the answers in an Adobe PDF or Microsoft Word document, including screenshots of your work in R.
 
3.┬áPlot the results of the ÔÇťhclustÔÇŁ operation into a Dendogram tree diagram. Add boxes around clusters you identified in the Dendogram. Present the answers in an Adobe PDF or Microsoft Word document, including screenshots of your work in R.
 
4. Commentary: Based on the six questions we asked, what types of segments would you expect to find?
Include research: What types of segments are typically found by market research such as this? (Hint: Google ÔÇťshopping mall customer segmentsÔÇŁ)
 
http://www.emeraldinsight.com/doi/abs/10.1108/09590550710828245
Attachments: